. 2014 Jan;21(1):56-63.
doi: 10.1038/nsmb.2705. Epub 2013 Dec 1.

Energetic analysis of the rhodopsin-G-protein complex links the α5 helix to GDP release

Affiliations

Energetic analysis of the rhodopsin-G-protein complex links the α5 helix to GDP release

Nathan S Alexander et al. Nat Struct Mol Biol. 2014 Jan.

Abstract

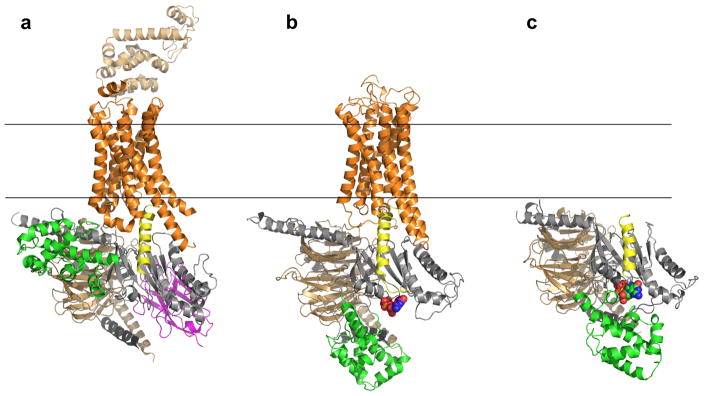
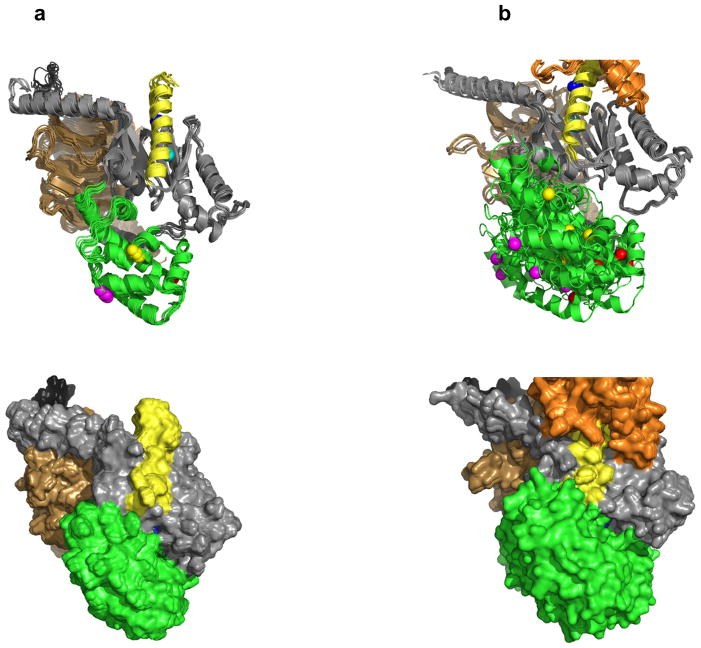
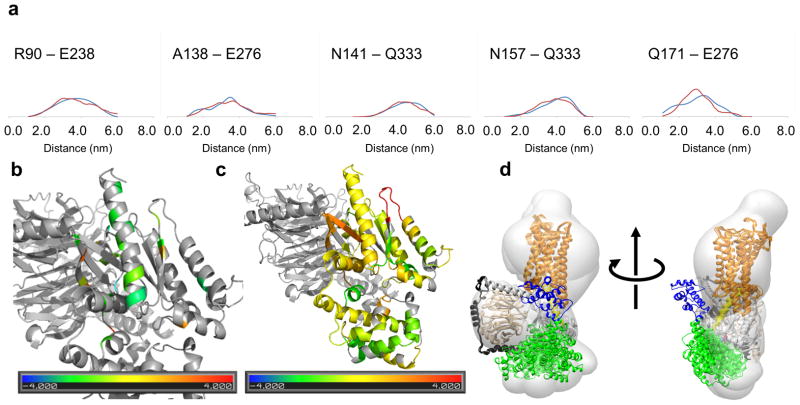
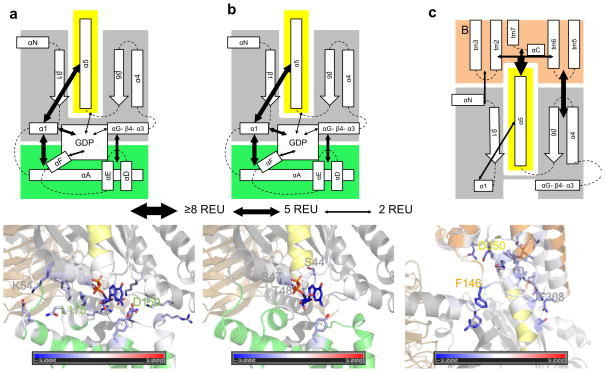
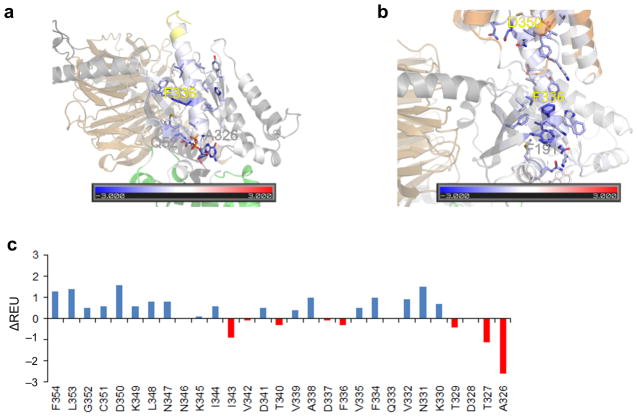
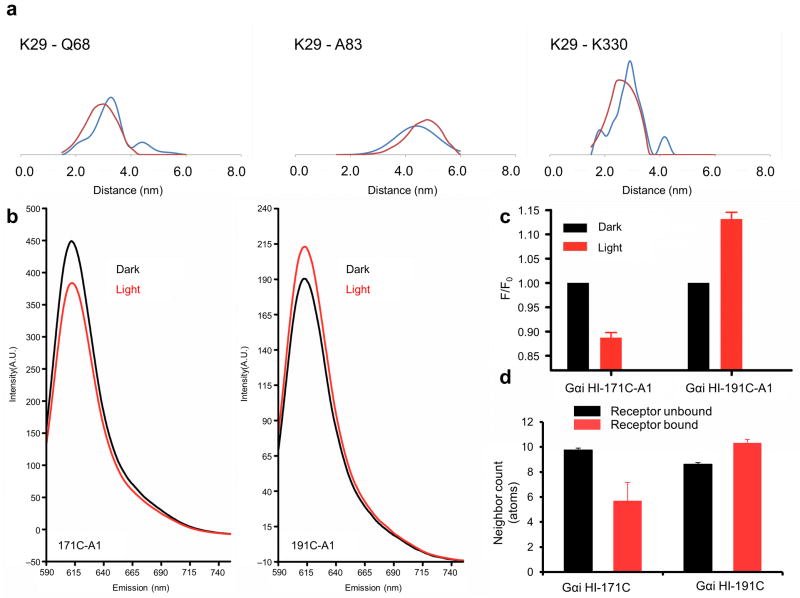
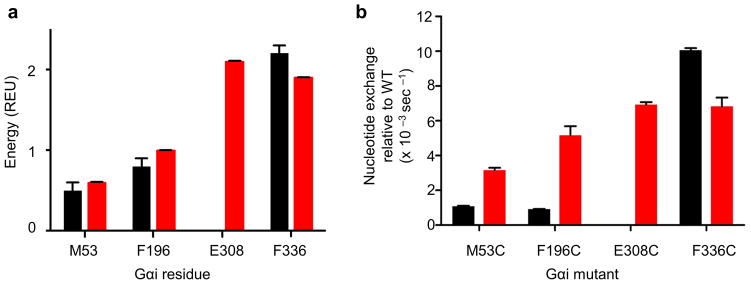
We present a model of interaction of Gi protein with the activated receptor (R*) rhodopsin, which pinpoints energetic contributions to activation and reconciles the β2 adrenergic receptor-Gs crystal structure with new and previously published experimental data. In silico analysis demonstrated energetic changes when the Gα C-terminal helix (α5) interacts with the R* cytoplasmic pocket, thus leading to displacement of the helical domain and GDP release. The model features a less dramatic domain opening compared with the crystal structure. The α5 helix undergoes a 63° rotation, accompanied by a 5.7-Å translation, that reorganizes interfaces between α5 and α1 helices and between α5 and β6-α5. Changes in the β6-α5 loop displace αG. All of these movements lead to opening of the GDP-binding pocket. The model creates a roadmap for experimental studies of receptor-mediated G-protein activation.


Figures

Figure 1
Figure 1
Overall structure of β2AR–Gs complex, our model of the R*–Gi complex, and the unbound Gi heterotrimer. (a) Crystal structure of β2AR–Gs complex (PDB 3SN6). The α5 helix of Gas is displaced 6Å towards the receptor and the helical domain (green) is displaced towards the membrane interface. (b) Unified model of the R*–Gi complex: According to DEER measurements, the displacement of helical domain (green) is on average a 15Å translation and 62º rotation after receptor binding. (c) Gi heterotrimer constructed as comparative model from Gt (PDB 1GOT) structure. Receptor (orange), Gα GTPase domain (grey), Gα helical domain (green), Gβ (light brown), Gγ (black), Nanobody (magenta), T4L (sand), GDP (in spheres).
Figure 2
Figure 2
Placement of helical domain and rotation of α5 as observed by EPR measurements. (a) Gi in the basal state. (b) Gi bound to activated receptor R*. To illustrate motion, landmark residues are colored: L092 (red), E122 (green), D158 (yellow), V335 (cyan), I343 (blue). In both cases we show an ensemble of models that collectively fits the experimental data best. (a bottom, b bottom) Space-filled representations of the helical domain illustrate its positions for the respective states.
Figure 3
Figure 3
Agreement of unified model with available experimental data. (a) Comparison of experimental distance distribution as observed in DEER measurements (blue) with the predicted distribution computed from the unified model of the R*–Gi complex (red). (b) Representation of the agreement with changes in accessibility observed in CW-EPR experimental data in C terminus | Gαi interface. Experimentally observed changes were classified into five groups from strong decrease (-2) to strong increase (+2). Average amino acid accessibility changes were classified likewise into five groups from strong decrease (-2) to strong increase (+2). Plotted is the difference, i.e. yellow and green colors indicate good agreement of model and experiment. (c) Agreement of unified model with changes in accessibility observed in deuterium exchange measurements using the same color scale as panel (b). (d) Agreement of unified model with single particle EM class averages.
Figure 4
Figure 4
Rosetta energetic analysis. (a) Analysis of energetics of helical domain|Gαi interface in free Gαi. The thickness of arrows in the top panel corresponds to the strength of the interaction in Rosetta Energy Units (REU, see legend). Residues in the bottom panel are colored by the interaction energy REU from red (repulsive) over white (neutral) to blue (attractive). Residues that contribute more than 0.5 REU are displayed as sticks and the three residues with the largest contributions are labeled. (b) Energetics of the GDP|Gαi interface in free Gαi. (c) Energetics of R*|Gαi interface in the R*-Gαi complex.
Figure 5
Figure 5
Rosetta energetic analysis of the interface between α5|Gαi-GTPase. (a) Basal state energetics. (b) Energetics of the R*–Gαi complex. Residues are colored by the interaction energy REU from red (repulsive) over white (neutral) to blue (attractive). Residues that contribute more than 0.5 REU are displayed as sticks and the three residues with the largest contributions are labeled. (c) Energy change (ΔREU) of C-terminal residues (β6–α5 loop and α5 helix) upon receptor binding. A blue color indicates stabilization, a red color indicates destabilization.
Figure 6
Figure 6
Agreement of unified model with new structural data. (a) Comparison of the experimental distance distribution as observed in DEER measurements (blue) with the predicted distribution computed from the ensemble mode of the R*–Gi complex (red). (b–d) Comparison of accessibility of residues 171 and 191 in Gαi in the basal (black) and activated state (red). (b) Residues 171 and 191 in a Gαi protein were specifically modified with Alexa-fluor (A1), and emission (Em) was scanned at A1-specific wavelengths. (c) Measured fluorescence of cysteine mutants labeled with a fluorescent probe. Data represent the mean of a minimum of three independent experiments. Error bars show standard error of the mean. (d) Predicted burial as indicated by neighbor count based on the unified model. Bars show mean, and error bars show standard deviation.
Figure 7
Figure 7
Validation of the model energetic predictions. (a) The predicted energetic contribution to a given residue’s corresponding interface is plotted for basal (black) and stimulated (red) states. Residues M53, F196, and F336 are within the α5 | Gαi interface. Residue E308 is within the R* | Gαi interface, and therefore no interface contributions are predicted in the basal state. Energy is given in Rosetta Energy Units (REU). Bars show mean, and error bars show standard deviation. (b) Basal and receptor-mediated nucleotide exchange rates. Gαi mutant exchange rates were compared, taking the absolute value of the difference of the nucleotide exchange rate relative to wild type Gαi in both basal and receptor mediated state. Data represent between 4 – 8 independent experiments, and error bars show standard error of the mean. The basal exchange of E308C was determined experimentally but was not significantly different from WT (wildtype), as was predicted by the model.

References

    1. Onrust R, et al. Receptor and βγ Binding Sites in the α Subunit of the Retinal G Protein Transducin. Science. 1997;275:381–384. - PubMed
    1. Cai K, Itoh Y, Khorana HG. Mapping of contact sites in complex formation between transducin and light-activated rhodopsin by covalent crosslinking: Use of a photoactivatable reagent. Proceedings of the National Academy of Sciences. 2001;98:4877–4882. - PMC - PubMed
    1. Mazzoni MR, Hamm HE. Interaction of Transducin with Light-activated Rhodopsin Protects It from Proteolytic Digestion by Trypsin. Journal of Biological Chemistry. 1996;271:30034–30040. - PubMed
    1. Slessareva JE, et al. Closely Related G-protein-coupled Receptors Use Multiple and Distinct Domains on G-protein α-Subunits for Selective Coupling. Journal of Biological Chemistry. 2003;278:50530–50536. - PubMed
    1. Marin EP, Krishna AG, Sakmar TP. Disruption of the alpha5 helix of transducin impairs rhodopsin-catalyzed nucleotide exchange. Biochemistry. 2002;41:6988–94. - PubMed

Publication types

MeSH terms