. 2014 Jan;124(1):99-110.
doi: 10.1172/JCI46266.

IL-2 therapy promotes suppressive ICOS+ Treg expansion in melanoma patients

IL-2 therapy promotes suppressive ICOS+ Treg expansion in melanoma patients

Geok Choo Sim et al. J Clin Invest. 2014 Jan.

Abstract

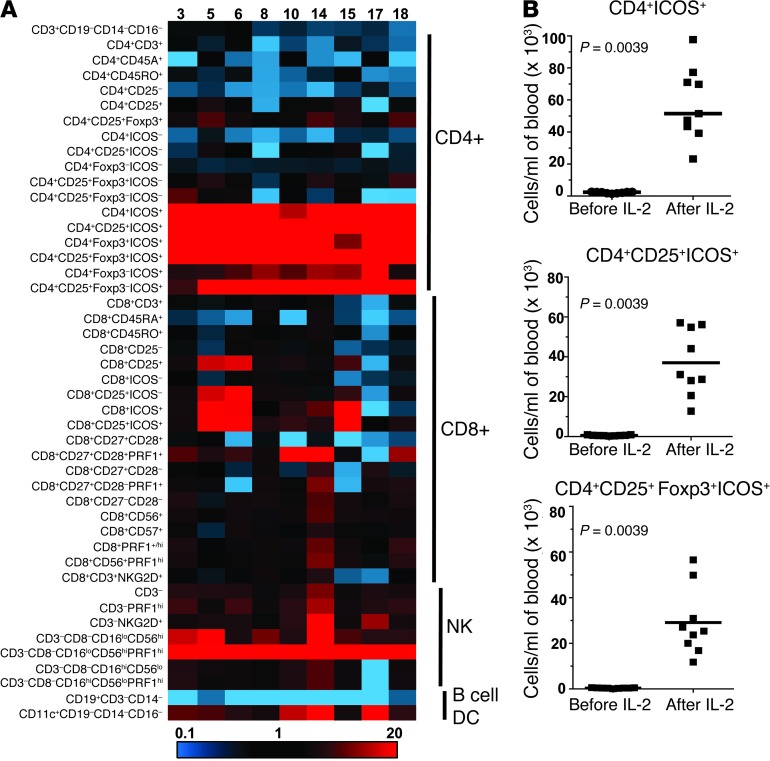
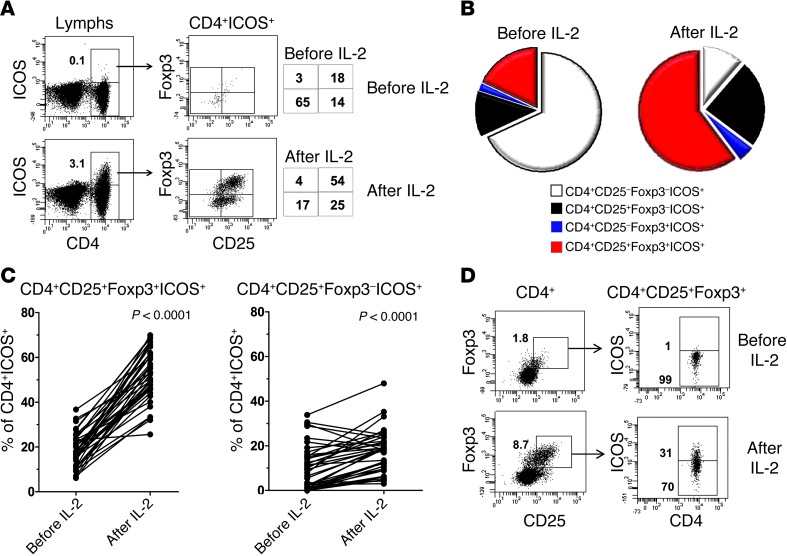
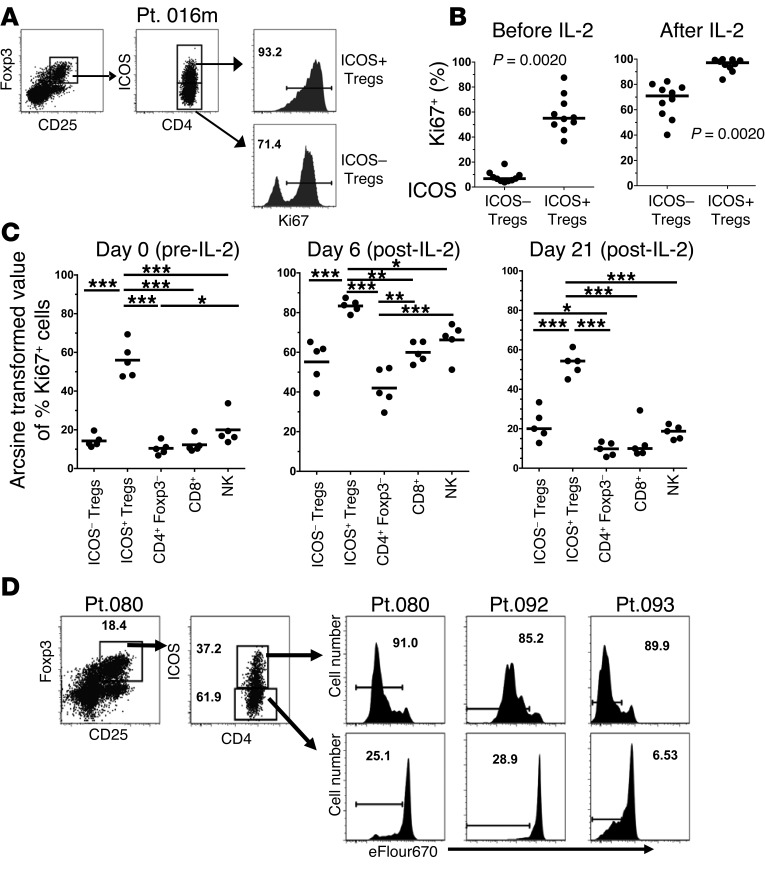
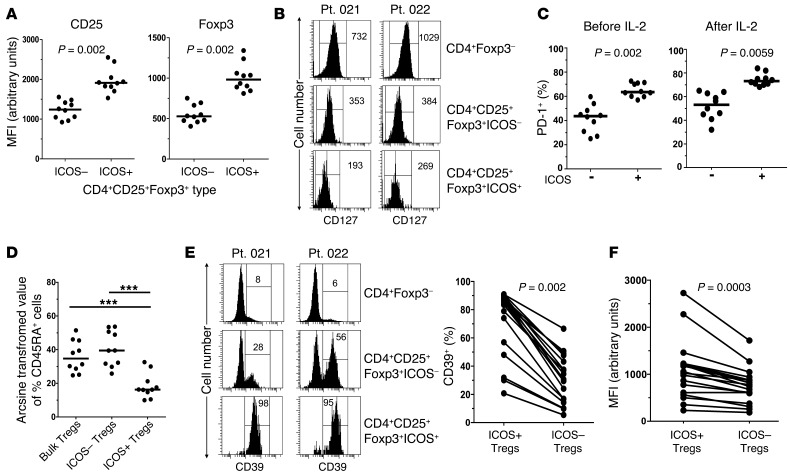
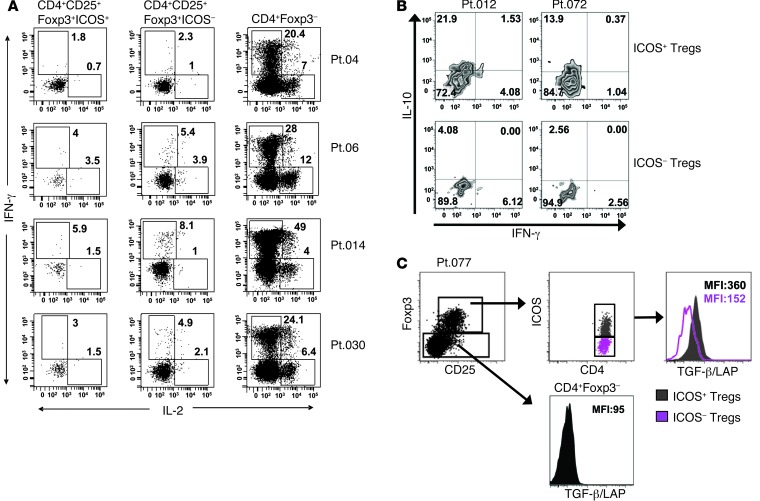
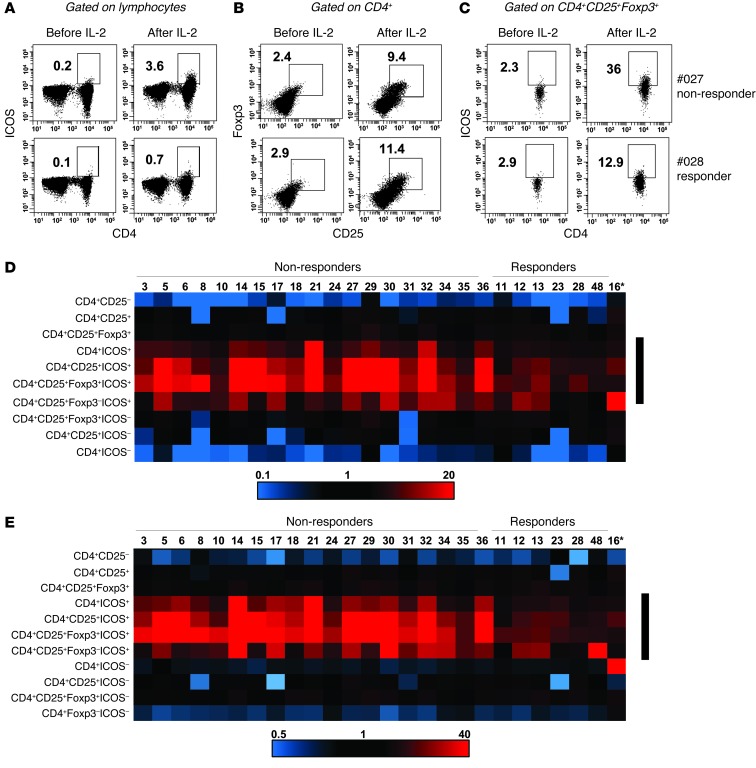
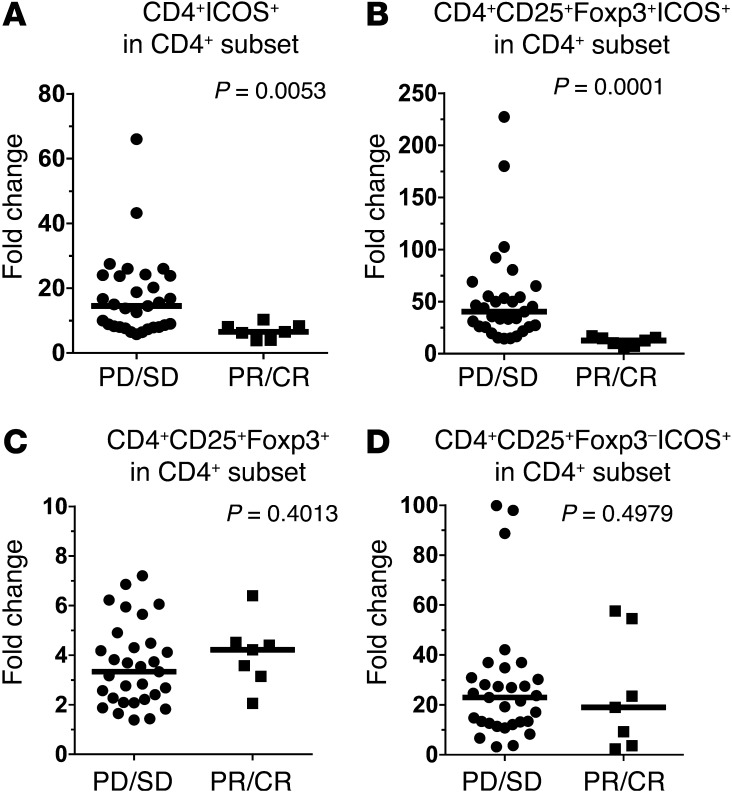
High-dose (HD) IL-2 therapy in patients with cancer increases the general population of Tregs, which are positive for CD4, CD25, and the Treg-specific marker Foxp3. It is unknown whether specific subsets of Tregs are activated and expanded during HD IL-2 therapy or whether activation of any particular Treg subset correlates with clinical outcome. Here, we evaluated Treg population subsets that were induced in patients with melanoma following HD IL-2 therapy. We identified a Treg population that was positive for CD4, CD25, Foxp3, and the inducible T cell costimulator (ICOS). This Treg population increased more than any other lymphocyte subset during HD IL-2 therapy and had an activated Treg phenotype, as indicated by high levels of CD39, CD73, and TGF-β. ICOS(+) Tregs were the most proliferative lymphocyte population in the blood after IL-2 therapy. Patients with melanoma with enhanced expansion of ICOS(+) Tregs in blood following the first cycle of HD IL-2 therapy had worse clinical outcomes than patients with fewer ICOS(+) Tregs. However, there was no difference in total Treg expansion between HD IL-2 responders and nonresponders. These data suggest that increased expansion of the ICOS(+) Treg population following the first cycle of HD IL-2 therapy may be predictive of clinical outcome.


Figures

Figure 1
Figure 1. CD4+ T cells expressing ICOS with phenotypic characteristics of Tregs increase the most in peripheral blood after HD IL-2 therapy.
PBMCs isolated at baseline and 2 days after the last dose of IL-2 during cycle 1 of HD IL-2 therapy from 9 patients (nonresponders) were stained for multiple T, B, and NK cell and DC markers. The percentage of 46 cell subsets in the live lymphocyte gate were determined, and the fold change in the frequency of each indicated cell subset in the lymphocyte gate was calculated by dividing the frequency of cells before HD IL-2 therapy by the frequency after treatment. (A) Changes in the percentage of indicated cell subsets analyzed for all 9 patients (patient numbers are shown at the top of the heat map) were heat mapped based on the fold changes, with the use of an Excel conditional formatting program, as indicated at the bottom of the figure. The major lymphocyte subpopulations corresponding to the different phenotypic marker subsets (left side) are indicated on the right side of the heat diagram. (B) Total numbers of CD4+ICOS+, CD4+CD25+ICOS+, and CD4+CD25+Foxp3+ICOS+ cells before IL-2 and 2 days after cycle 1 of HD IL-2 therapy (after IL-2) are shown for these 9 patients. Total cell numbers were calculated by multiplying the percentage of each subset in the viable lymphocyte gate by the absolute lymphocyte count. Horizontal bars represent median values. Statistical analyses were performed with 2-tailed Wilcoxon matched paired test.
Figure 2
Figure 2. Activated CD4+CD25+ICOS+ T cells expanded during HD IL-2 therapy are primarily in the CD4+CD25+Foxp3+ subset.
(A) Dot plots show PBMCs that were isolated from an HD IL-2–treated patient (no. 032) and stained for CD4, CD25, Foxp3, and ICOS before and 2 days after cycle 1 of HD IL-2 therapy. Percentages of CD4+ICOS+ T cells in total lymphocytes (Lymphs) and in the CD25+Foxp3+ subset are as indicated in and beside dot plots. A minimum of 40,000 to 50,000 viable lymphocytes were analyzed at each time point for this patient and for all other patients analyzed. (B) The changes in frequency of CD25Foxp3, CD25Foxp3+, CD25+Foxp3, and CD25+Foxp3+ cells in the CD4+ICOS+ T cell gate before and after IL-2 therapy in a representative nonresponding patient (no. 014). (C) Graphs depict changes in the frequency of CD25+Foxp3+ T cells in the activated CD4+ICOS+ T cell subset versus the frequency of T cells in the corresponding Foxp3 subpopulation after HD IL-2 therapy (n = 38). (D) A large increase in the ICOS+ cell fraction within the gated CD4+CD25+Foxp3+ subset after cycle 1 of HD IL-2 therapy in a representative patient (no. 006). Percentages of indicated cell subsets are shown in dot plots. Statistical analyses were performed with 2-tailed Wilcoxon matched paired test.
Figure 3
Figure 3. ICOS+ Tregs (CD4+CD25+Foxp3+) are more highly activated and more highly cycling than ICOS Tregs or other lymphocyte subsets before and after HD IL-2 therapy.
(A) Flow cytometry staining for Ki67 expression using intracellular flow cytometry staining in ICOS+ and ICOS Treg subsets before and after cycle 1 of HD IL-2 therapy. Frequencies of Ki67+ cells are as indicated in dot plots. (B) Summary results from 10 patients are shown in scatter plots. (C) PBMCs from 5 patients were stained for the indicated subsets together with intracellular staining for Ki67 before therapy (day 0), shortly after therapy (day 6), and 3 weeks after therapy (day 21) (see Methods section). Percentages of Ki67+ cells in each lymphocyte subset were determined and then arcsine transformed for 1-way ANOVA and Tukey’s multiple comparison analysis. Arcsine-transformed values were plotted for the indicated subsets. Horizontal bars represent median values. (D) Fresh PBMCs from 3 patients shortly after HD IL-2 therapy (day 6) were isolated and stained with eFluor 670 dye for the dye dilution proliferation assay. Cells were cultured for 5 days in the presence of HD IL-2 (3,000 IU/ml). After 5 days, cells were harvested and stained for Treg markers. The gating strategy and frequencies of indicated cell subsets are as shown in dot plots. Frequencies of proliferative cells in ICOS+ and ICOS Treg subsets are as indicated in histograms (***P < 0.001, **0.001 < P < 0.01, *0.01 < P < 0.05).
Figure 4
Figure 4. CD4+CD25+Foxp3+ICOS+ T cells increased during HD IL-2 therapy and have properties of suppressive Tregs.
PBMCs from patients with melanoma after HD IL-2 therapy (2 days after last IL-2 dose in cycle 1 of therapy) were thawed and stained for various marker attributes to Treg activation and suppression function. (A) Scatter plots depict the intensity of CD25 and Foxp3 expression in the CD4+CD25+Foxp3+ subset based on ICOS expression from 10 representative patients. (B) CD127 expression and (C) frequency of PD-1–expressing ICOS+ and ICOS Tregs before and after HD IL-2 therapy. Median fluorescence intensity (MFI) is indicated in B. (D) Percentages of CD45RA-expressing cells in bulk Tregs and ICOS+ and ICOS Tregs from 10 representative patients were determined and arcsine transformed for 1-way ANOVA and Tukey’s multiple comparison analysis. (E) Frequencies of CD39+ cells in CD4+ Foxp3, CD4+CD25+Foxp3+ICOS, and CD4+CD25+Foxp3+ICOS+ cells are as indicated in histograms and in the graph. (F) Graph shows the median fluorescence intensity of CD39 expression in ICOS+ and ICOS Tregs in HD IL-2–treated patients (n = 18). Horizontal bars represent median values. P < 0.05 was considered significant (***P < 0.001).
Figure 5
Figure 5. Cytokine production profiles of ICOS+ and ICOS Tregs.
(A) PBMCs were stimulated with PMA/ionomycin for 6 hours, and the secretion of IFN-γ or IL-2 in CD4+Foxp3 T cells (non-Treg) and in ICOS+ and ICOS Treg subsets was determined with use of intracellular cytokine staining and measured by using flow cytometry. Results from 4 patients are shown. (B) PBMCs from HD IL-2–treated patients after HD IL-2 (cycle 1 of therapy) were thawed and stimulated with PMA (50 ng/ml) and ionomycin (2 μg/ml) for 24 hours. GolgiStop was added 1 hour after the PMA/ionomycin stimulation and further incubated for the rest of the stimulation period. Cells were harvested and stained for CD4, CD25, Foxp3, ICOS, IFN-γ, and IL-10. The production of IL-10 or IFN-γ by ICOS+ and by ICOS Tregs is shown for 2 representative patients. Frequencies of cytokine-producing cells in indicated cell subset are shown in A and B. (C) Histograms from 1 representative patient with melanoma show the cell surface expression of TGF-β/LAP in ICOS+ and ICOS Tregs as well as in CD4+Foxp3 T cells after cycle 1 of HD IL-2 therapy. The median fluorescence intensity values are as indicated in the histograms.
Figure 6
Figure 6. Changes in CD4+ICOS+ and CD4+CD25+Foxp3+ICOS+ T cells during HD IL-2 therapy in responding and nonresponding patients.
(A) Frequencies of CD4+ICOS+ T cells in the total viable lymphocyte gate are shown before and after cycle 1 of HD IL-2 therapy for a representative nonresponder (no. 027) and responder (no. 028). (B) Changes in the frequency of CD25+Foxp3+ in the gated CD4+ T cell subpopulation and (C) ICOS+ cells within the gated CD4+CD25+Foxp3+ subpopulation before and after cycle 1 of HD IL-2 therapy for the same nonresponder and responder. Frequencies of indicated cell subsets are indicated in AC. (D and E) Analysis of the fold changes in different ICOS+ and ICOS subsets during HD IL-2 therapy in nonresponding (n = 19) and responding (n = 7) patients. The indicated cell subsets were analyzed by flow cytometry before and 2 days after cycle 1 of therapy, and the fold change of each population was heat mapped by using an Excel conditional formatting program. Heat diagrams show the fold changes in the indicated T cell subsets as (D) the percentage of total peripheral blood lymphocytes in nonresponder and responders and (E) a percentage of the CD4+ subpopulation in nonresponders and responders (patient numbers are shown at the top of the heat map). The black bars on the right of each heat diagram indicate the CD4+ICOS+ subsets showing the greatest differences between responding and nonresponding patients. The asterisk denotes patient number 16 who received prior vaccination with recombinant MAGE-A3 vaccine before HD IL-2 therapy.
Figure 7
Figure 7. CD4+CD25+Foxp3+ICOS+ Tregs in patients who eventually respond to therapy increased to a lesser extent after HD IL-2 cycle 1.
Comparison of the fold change of (A) CD4+ICOS+ cells, (B) CD4+CD25+Foxp3+ICOS+ cells, (C) CD4+CD25+Foxp3+ cells, and (D) CD4+CD25+Foxp3ICOS+ cells as a percentage of the total CD4+ compartment between nonresponders (progressive disease/stable disease [PD/SD]) (n = 31) and responders (partial response/complete response [PR/CR]) (n = 7). Fold change was calculated by dividing the percentage of each indicated subset before HD IL-2 therapy by the percentage after therapy. The horizontal bar in each scatter plot represents the median value of the fold change. Statistical analyses were performed with 2-tailed Mann-Whitney test for unpaired data. P < 0.05 was considered significant.

References

    1. Atkins MB, et al. High-dose recombinant interleukin 2 therapy for patients with metastatic melanoma: analysis of 270 patients treated between 1985 and 1993. J Clin Oncol. 1999;17(7):2105–2116. - PubMed
    1. Dutcher J. Current status of interleukin-2 therapy for metastatic renal cell carcinoma and metastatic melanoma. Oncology (Williston Park). 2002;16(11 suppl 13):4–10. - PubMed
    1. Kirkwood JM, et al. Next generation of immunotherapy for melanoma. J Clin Oncol. 2008;26(20):3445–3455. doi: 10.1200/JCO.2007.14.6423. - DOI - PubMed
    1. Whittington R, Faulds D. Interleukin-2. A review of its pharmacological properties and therapeutic use in patients with cancer. Drugs. 1993;46(3):446–514. doi: 10.2165/00003495-199346030-00009. - DOI - PubMed
    1. Fyfe G, et al. Results of treatment of 255 patients with metastatic renal cell carcinoma who received high-dose recombinant interleukin-2 therapy. J Clin Oncol. 1995;13(3):688–696. - PubMed

Publication types

MeSH terms