. 2014 May;127(5):747-59.
doi: 10.1007/s00401-013-1217-3. Epub 2013 Nov 29.

Quantitative assessment of intragenic receptor tyrosine kinase deletions in primary glioblastomas: their prevalence and molecular correlates

Affiliations

Quantitative assessment of intragenic receptor tyrosine kinase deletions in primary glioblastomas: their prevalence and molecular correlates

Edward R Kastenhuber et al. Acta Neuropathol. 2014 May.

Abstract

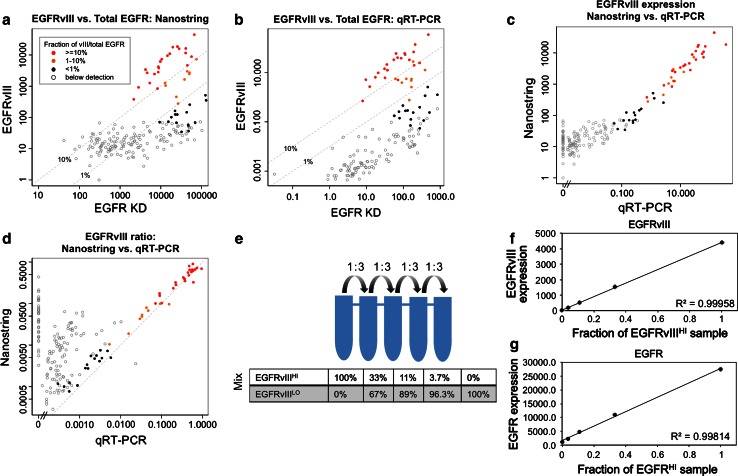
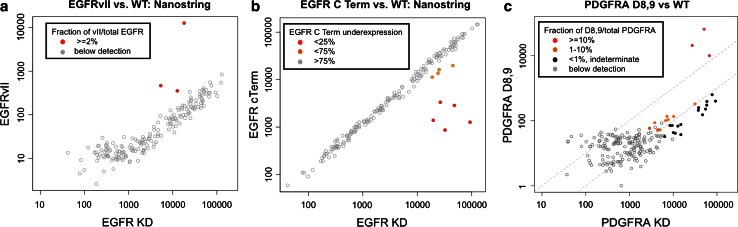
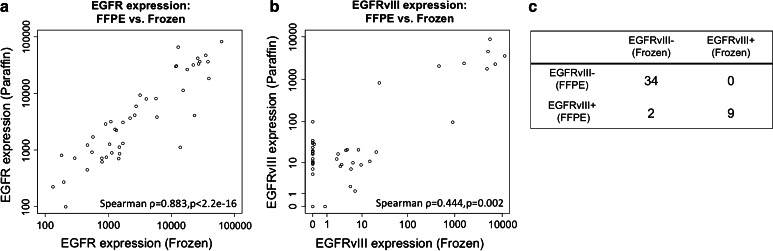
Intragenic deletion is the most common form of activating mutation among receptor tyrosine kinases (RTK) in glioblastoma. However, these events are not detected by conventional DNA sequencing methods commonly utilized for tumor genotyping. To comprehensively assess the frequency, distribution, and expression levels of common RTK deletion mutants in glioblastoma, we analyzed RNA from a set of 192 glioblastoma samples from The Cancer Genome Atlas for the expression of EGFRvIII, EGFRvII, EGFRvV (carboxyl-terminal deletion), and PDGFRAΔ8,9. These mutations were detected in 24, 1.6, 4.7, and 1.6 % of cases, respectively. Overall, 29 % (55/189) of glioblastomas expressed at least one RTK intragenic deletion transcript in this panel. For EGFRvIII, samples were analyzed by both quantitative real-time PCR (QRT-PCR) and single mRNA molecule counting on the Nanostring nCounter platform. Nanostring proved to be highly sensitive, specific, and linear, with sensitivity comparable or exceeding that of RNA seq. We evaluated the prognostic significance and molecular correlates of RTK rearrangements. EGFRvIII was only detectable in tumors with focal amplification of the gene. Moreover, we found that EGFRvIII expression was not prognostic of poor outcome and that neither recurrent copy number alterations nor global changes in gene expression differentiate EGFRvIII-positive tumors from tumors with amplification of wild-type EGFR. The wide range of expression of mutant alleles and co-expression of multiple EGFR variants suggests that quantitative RNA-based clinical assays will be important for assessing the relative expression of intragenic deletions as therapeutic targets and/or candidate biomarkers. To this end, we demonstrate the performance of the Nanostring assay in RNA derived from routinely collected formalin-fixed paraffin-embedded tissue.


Figures

Fig. 1
Fig. 1
Expression of EGFRvIII as a fraction of total EGFR is quantified by Nanostring assay and qRT-PCR in 189 GBMs. a Expression of EGFRvIII (exon 1–8 junctional probe) is shown as a function of EGFR kinase domain (KD), determined by normalized Nanostring (NS) counts. Expression levels are classified as high [red mutation in >10 % transcribed allelic fraction (TAF)], intermediate (orange 1–10 % TAF), marginal (black <1 % TAF) or negative (open circles). These color assignments are carried through panels bd. b Correlation of EGFRvIII expression between NS and qRT-PCR. Normalized expression levels are plotted for EGFRvIII and KD from the Taqman assay (see “Methods”). Samples are colored according to NS expression classification from Fig. 1a. c Cross-platform correlation of EGFRvIII epression, NS vs. qRT-PCR. d Cross-platform correlation of EGFRvIII as a fraction of total EGFR, NS vs. qRT-PCR. e Experimental design of dilution experiment to establish linearity of the Nanostring assay. A sample with high relative expression of EGFRvIII was diluted with a sample negative for EGFRvIII expression, maintaining a constant 250 ng of total RNA in each reaction. f Counts of EGFRvIII and EGFR KD as a function of diluted fraction of EGFRvIII-containing sample
Fig. 2
Fig. 2
Comparison with orthogonal platforms a EGFRvIII vs. total EGFR as determined by Nanostring is plotted. EGFRvIII expression was determined independently from TCGA RNA-seq analysis (RNAS). Red denotes cases with >10 % TAF by RNAS, green 1–10 % and blue <1 %. Black circles filled with gray mark cases where no RNAS reads identified EGFRvIII; empty circles mark cases for which RNA-seq data were unavailable. b EGFRvIII expression was compared with genomic loss of EGFR exons 2–7 in 157 cases for which both RNA and DNA (exome) sequencing data were available. Samples are ordered by the magnitude of exon 2–7 deletion inferred from DNA seq coverage. Expression was determined by the ratio of VIII junction RPKM to total EGFR
Fig. 3
Fig. 3
Assessment of EGFRvII, EGFRvV and PDGFRAΔ8,9 using Nanostring probes. a Probes targeting the aberrant junctions characterizing EGFRvII expression levels are classified as positive (red mutation in >2 % TAF), or not detected (open circles). b EGFRvV (C-terminal deletion) is detected by relative under-representation of exon 28 vs. exon 19 harboring the kinase domain (KD). c PDGFRAΔ8,9 expression is stratified as in Fig. 1a
Fig. 4
Fig. 4
Performance of Nanostring assay applied to suboptimal material. Counts of EGFR-WT (a) and EGFRvIII (b) are correlated between patient-matched samples maintained by optimal, flash-frozen, and suboptimal, versus formalin-fixed paraffin-embedded samples (FFPE), preservation methods. c Concordance of NS assay as a binary classifier from FFPE and frozen material
Fig. 5
Fig. 5
Genomic and clinical correlates of EGFRvIII expression. a Significant EGFRvIII expression is exclusively found in tumors with amplification of EGFR. NS counts of EGFRvIII expression are plotted with respect to kinase domain counts. Blue circles denote samples with EGFR point mutation. Red denotes tumors with high-level amplification of the EGFR locus (aCGH log2 ratio >2). For two samples with high EGFRvIII expression, but log2 ratios below 2 (red arrows), aCGH demonstrates focal CNA in a pattern consistent with high-level gene amplification in a subpopulation of cells (and demonstrated by FISH for one of the two cases [43]). b Association between EGFR status and transcriptomal subclass. c Overall survival of patients stratified by EGFRvIII status. d Overall survival of patients stratified by EGFRvIII status excluding G-CIMP tumors, which are known to have a more favorable prognosis
Fig. 6
Fig. 6
Molecular context of EGFR alterations in GBM. From top to bottom EGFR mRNA expression, DNA copy number, deletion mutation expression, transcriptomal and methylation subclass are reported for each sample

References

    1. Al-Nedawi K, Meehan B, Micallef J, et al. Intercellular transfer of the oncogenic receptor EGFRvIII by microvesicles derived from tumour cells. Nat Cell Biol. 2008;10:619–624. doi: 10.1038/ncb1725. - DOI - PubMed
    1. Aldape KD, Ballman K, Furth A, et al. Immunohistochemical detection of EGFRvIII in high malignancy grade astrocytomas and evaluation of prognostic significance. J Neuropathol Exp Neurol. 2004;63:700–707. - PubMed
    1. Biernat W, Huang H, Yokoo H, Kleihues P, Ohgaki H. Predominant expression of mutant EGFR (EGFRvIII) is rare in primary glioblastomas. Brain Pathol. 2004;14:131–136. doi: 10.1111/j.1750-3639.2004.tb00045.x. - DOI - PMC - PubMed
    1. Brennan C, Momota H, Hambardzumyan D, et al. Glioblastoma subclasses can be defined by activity among signal transduction pathways and associated genomic alterations. PLoS One. 2009;4:e7752. doi: 10.1371/journal.pone.0007752. - DOI - PMC - PubMed
    1. Brennan CW, Verhaak RG, McKenna A, et al. The somatic genomic landscape of glioblastoma. Cell. 2013;155:462–477. doi: 10.1016/j.cell.2013.09.034. - DOI - PMC - PubMed

Publication types

MeSH terms