

A subset of cholinergic mushroom body neurons requires Go signaling to regulate sleep in Drosophila
- PMID: 24293755
- PMCID: PMC3825430
- DOI: 10.5665/sleep.3206
A subset of cholinergic mushroom body neurons requires Go signaling to regulate sleep in Drosophila
Abstract
Study objectives: Identifying the neurochemistry and neural circuitry of sleep regulation is critical for understanding sleep and various sleep disorders. Fruit flies display sleep-like behavior, sharing essential features with sleep of vertebrate. In the fruit fly's central brain, the mushroom body (MB) has been highlighted as a sleep center; however, its neurochemical nature remains unclear, and whether it promotes sleep or wake is still a topic of controversy.
Design: We used a video recording system to accurately monitor the locomotor activity and sleep status. Gene expression was temporally and regionally manipulated by heat induction and the Gal4/UAS system.
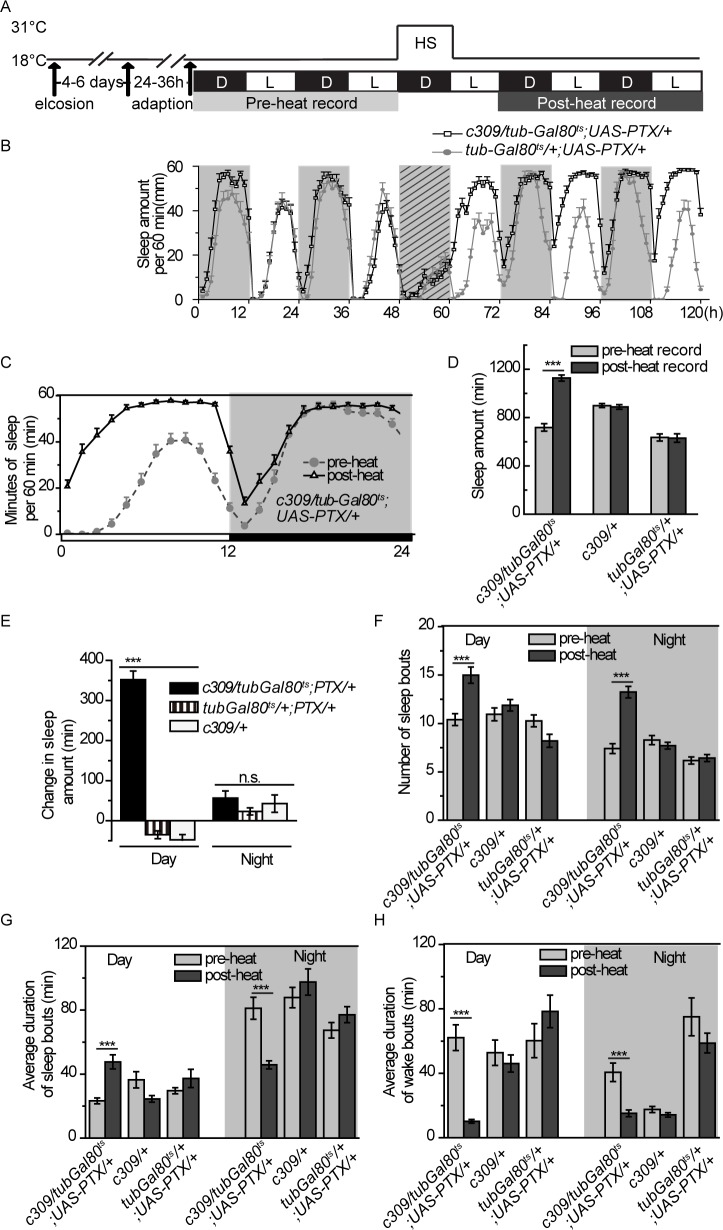
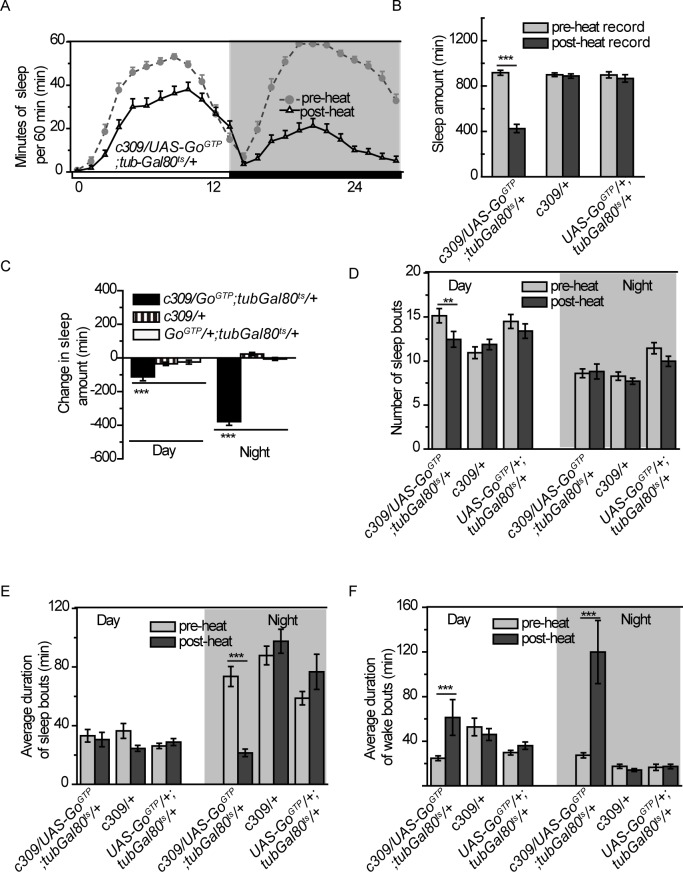
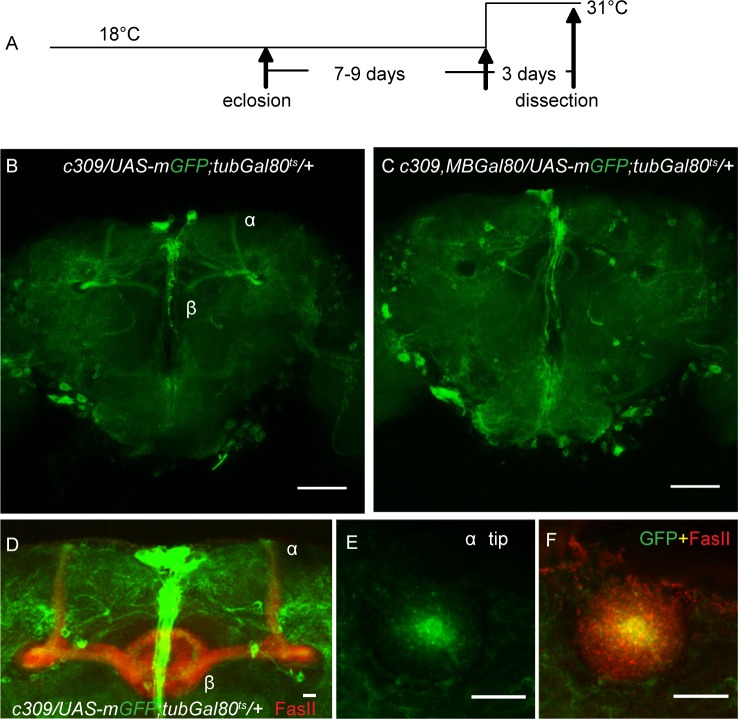
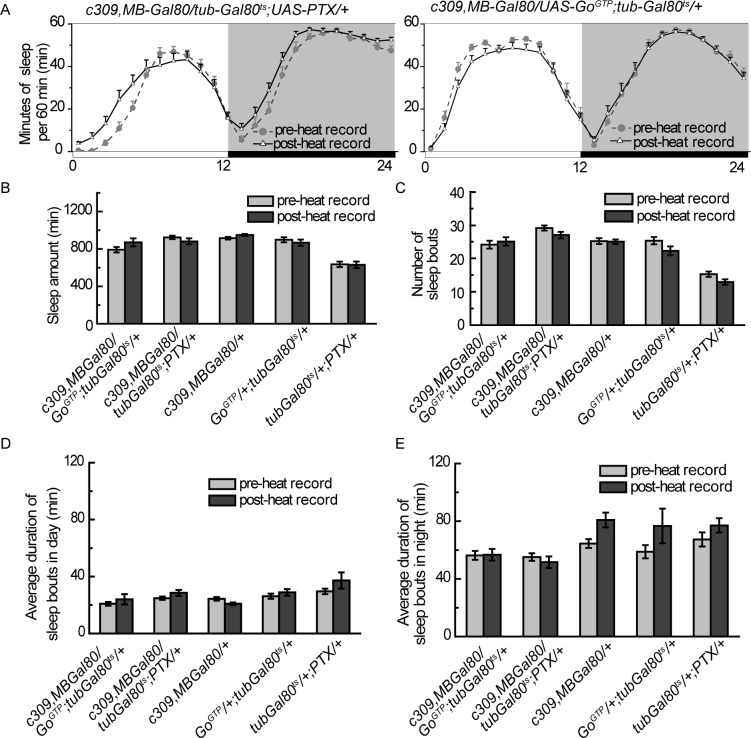
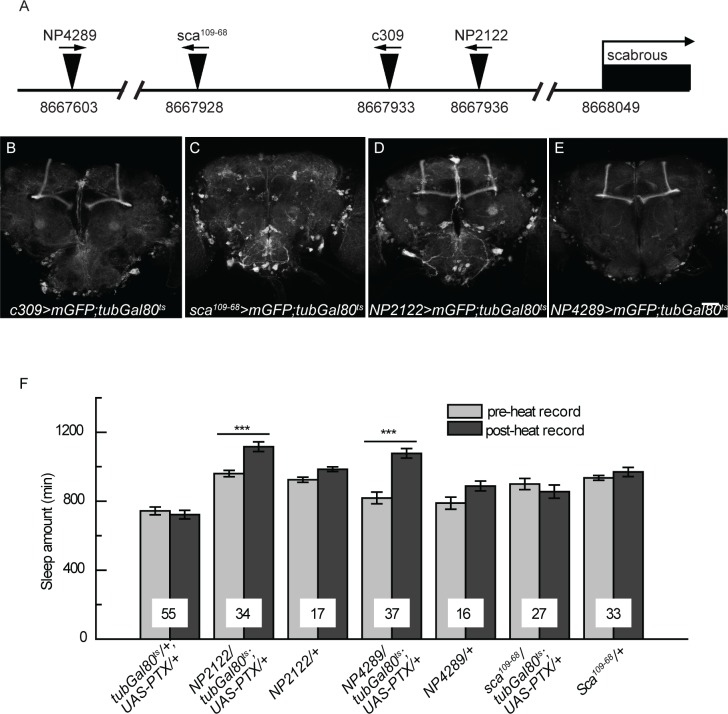
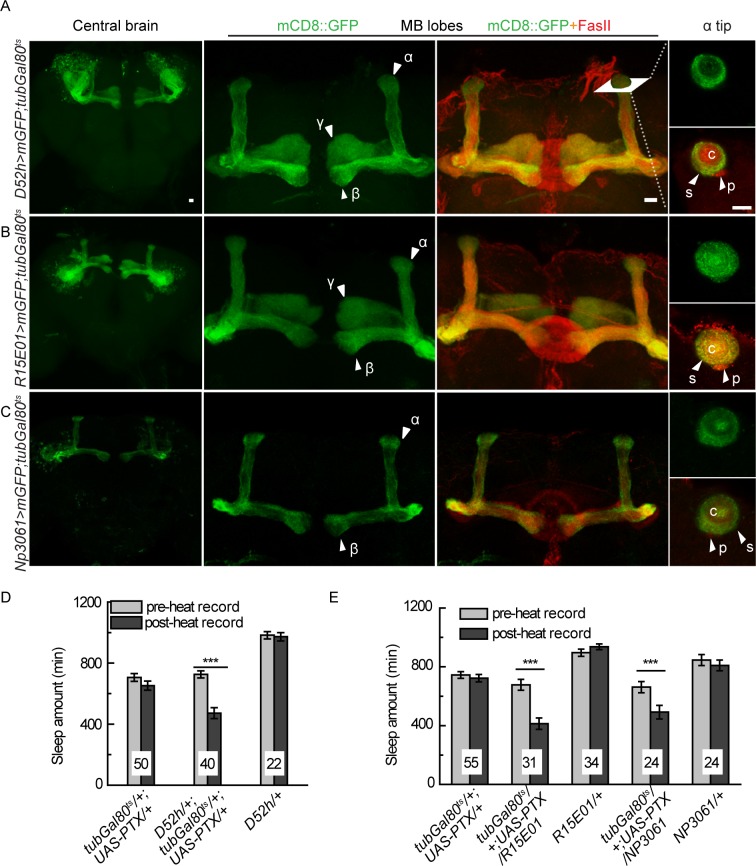
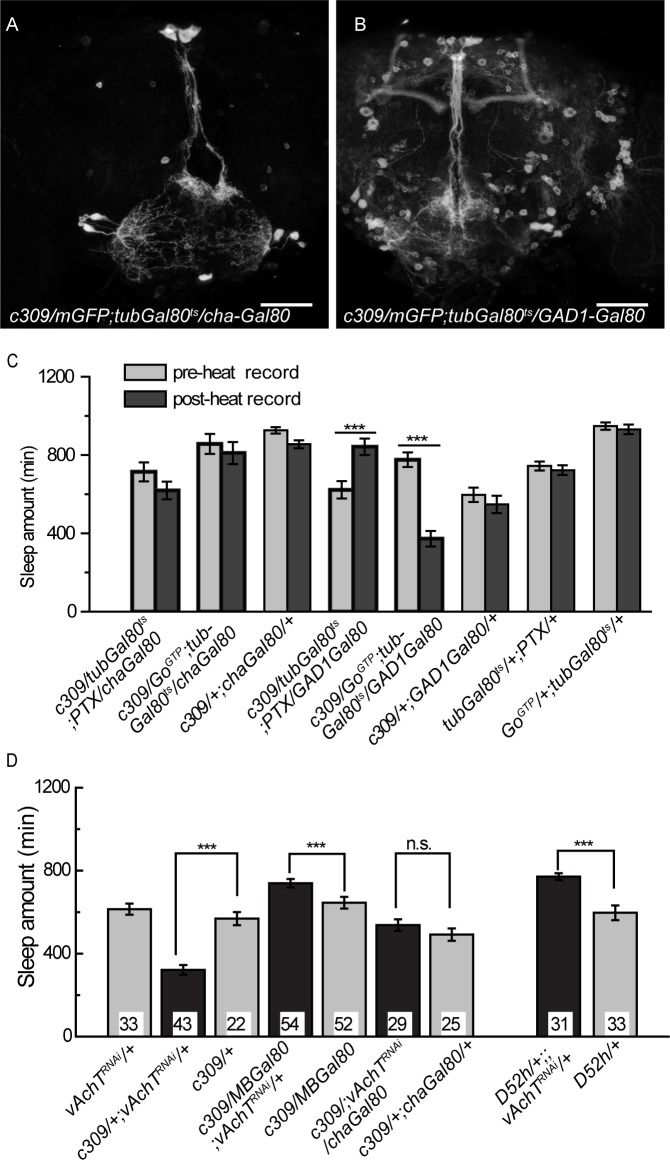
Measurements and results: We found that expressing pertussis toxin (PTX) in the MB by c309-Gal4 to block Go activity led to unique sleep defects as dramatic sleep increase in daytime and fragmented sleep in nighttime. We narrowed down the c309-Gal4 expressing brain regions to the MB α/β core neurons that are responsible for the Go-mediated sleep effects. Using genetic tools of neurotransmitter-specific Gal80 and RNA interference approach to suppress acetylcholine signal, we demonstrated that these MB α/β core neurons were cholinergic and sleep-promoting neurons, supporting that Go mediates an inhibitory signal. Interestingly, we found that adjacent MB α/β neurons were also cholinergic but wake-promoting neurons, in which Go signal was also required.
Conclusion: Our findings in fruit flies characterized a group of sleep-promoting neurons surrounded by a group of wake-promoting neurons. The two groups of neurons are both cholinergic and use Go inhibitory signal to regulate sleep.
Keywords: Go signaling; Mushroom body; cholinergic neurons; sleep.
Figures
Similar articles
-
Go signaling in mushroom bodies regulates sleep in Drosophila.Sleep. 2011 Mar 1;34(3):273-81. doi: 10.1093/sleep/34.3.273. Sleep. 2011. PMID: 21358844 Free PMC article.
-
Mushroom body signaling is required for locomotor activity rhythms in Drosophila.Neurosci Res. 2016 Oct;111:25-33. doi: 10.1016/j.neures.2016.04.005. Epub 2016 Apr 19. Neurosci Res. 2016. PMID: 27106579
-
Compartment specific regulation of sleep by mushroom body requires GABA and dopaminergic signaling.Sci Rep. 2021 Oct 8;11(1):20067. doi: 10.1038/s41598-021-99531-2. Sci Rep. 2021. PMID: 34625611 Free PMC article.
-
Genes and neural circuits for sleep of the fruit fly.Neurosci Res. 2017 May;118:82-91. doi: 10.1016/j.neures.2017.04.010. Epub 2017 Apr 21. Neurosci Res. 2017. PMID: 28438481 Review.
-
The Drosophila circuitry of sleep-wake regulation.Curr Opin Neurobiol. 2017 Jun;44:243-250. doi: 10.1016/j.conb.2017.03.004. Epub 2017 Mar 30. Curr Opin Neurobiol. 2017. PMID: 28366532 Free PMC article. Review.
Cited by
-
Gap junction networks in mushroom bodies participate in visual learning and memory in Drosophila.Elife. 2016 May 24;5:e13238. doi: 10.7554/eLife.13238. Elife. 2016. PMID: 27218450 Free PMC article.
-
Neural and non-neural contributions to sexual dimorphism of mid-day sleep in Drosophila melanogaster: a pilot study.Physiol Entomol. 2016 Dec;41(4):327-334. doi: 10.1111/phen.12134. Epub 2016 Feb 19. Physiol Entomol. 2016. PMID: 27840547 Free PMC article.
-
Glutamate Is a Wake-Active Neurotransmitter in Drosophila melanogaster.Sleep. 2017 Feb 1;40(2):zsw046. doi: 10.1093/sleep/zsw046. Sleep. 2017. PMID: 28364503 Free PMC article.
-
LKB1 is physiologically required for sleep from Drosophila melanogaster to the Mus musculus.Genetics. 2022 Jul 4;221(3):iyac082. doi: 10.1093/genetics/iyac082. Genetics. 2022. PMID: 35579349 Free PMC article.
-
Better Sleep at Night: How Light Influences Sleep in Drosophila.Front Physiol. 2020 Sep 4;11:997. doi: 10.3389/fphys.2020.00997. eCollection 2020. Front Physiol. 2020. PMID: 33013437 Free PMC article. Review.
References
-
- Hendricks JC, Finn SM, Panckeri KA, et al. Rest in Drosophila is a sleep-like state. Neuron. 2000;25:129–38. - PubMed
-
- Shaw PJ, Cirelli C, Greenspan RJ, Tononi G. Correlates of sleep and waking in Drosophila melanogaster. Science. 2000;287:1834–7. - PubMed
-
- Nitz DA, van Swinderen B, Tononi G, Greenspan RJ. Electrophysiological correlates of rest and activity in Drosophila melanogaster. Curr Biol. 2002;12:1934–40. - PubMed
-
- van Swinderen B, Nitz DA, Greenspan RJ. Uncoupling of brain activity from movement defines arousal states in Drosophila. Curr Biol. 2004;14:81–7. - PubMed
Publication types
MeSH terms
Substances
LinkOut - more resources
Full Text Sources
Other Literature Sources
Molecular Biology Databases
Research Materials
Miscellaneous
