

Plastic surgery wait times in Ontario: A potential surrogate for workforce demand
- PMID: 24294015
- PMCID: PMC3513250
- DOI: 10.1177/229255031202000411
Plastic surgery wait times in Ontario: A potential surrogate for workforce demand
Abstract
Background: Accurate projections of plastic surgeon workforce requirements are essential to ensure a high standard of care and to properly allocate health care resources. Wait-time data were used to identify geographical areas that may benefit from additional plastic surgeons.
Methods: Plastic surgery wait times were analyzed using data from Ontario's Wait Time Information System for 2009 to 2010. Data were compared with benchmarks published by the Canadian Society of Plastic Surgeons, and plastic surgeon density was captured by the Ontario Physician Human Resources Data Centre.
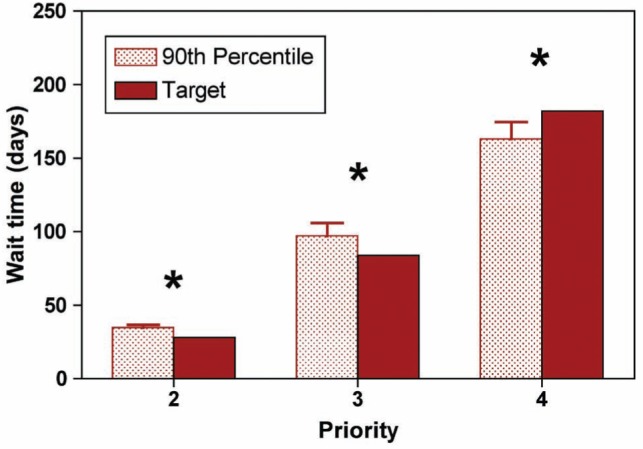
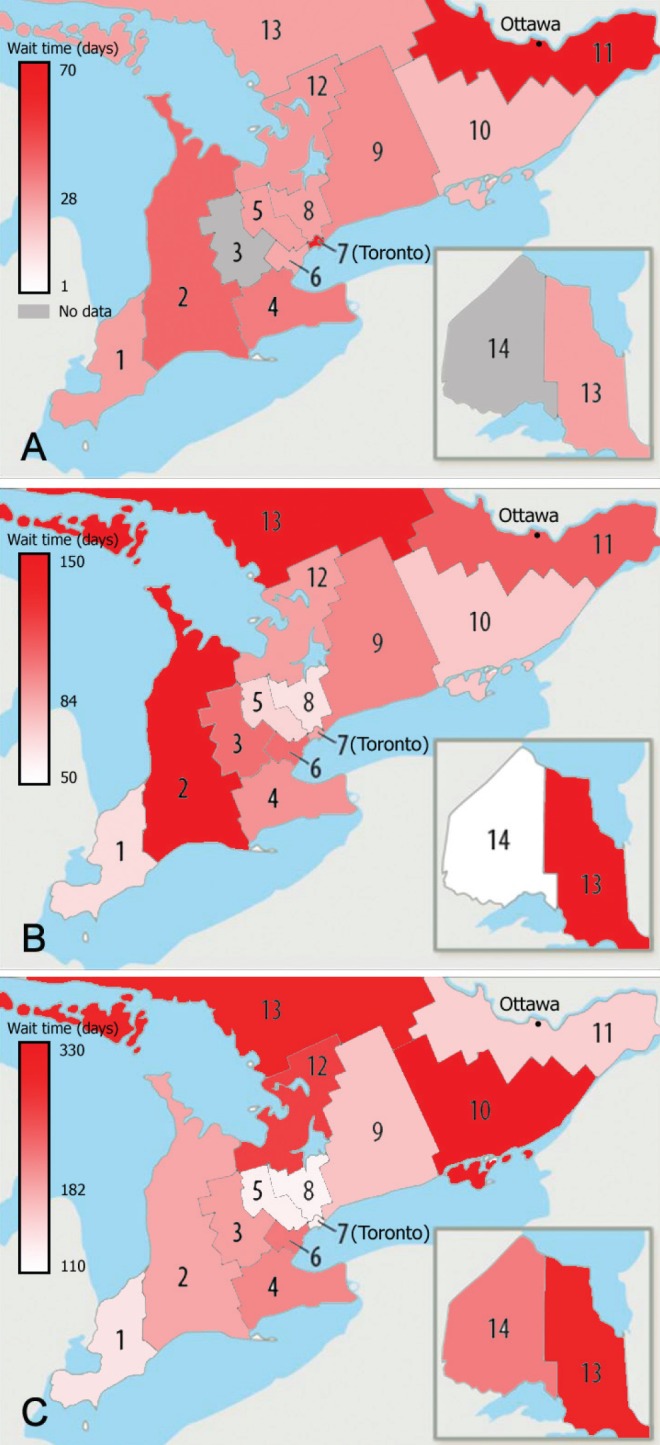
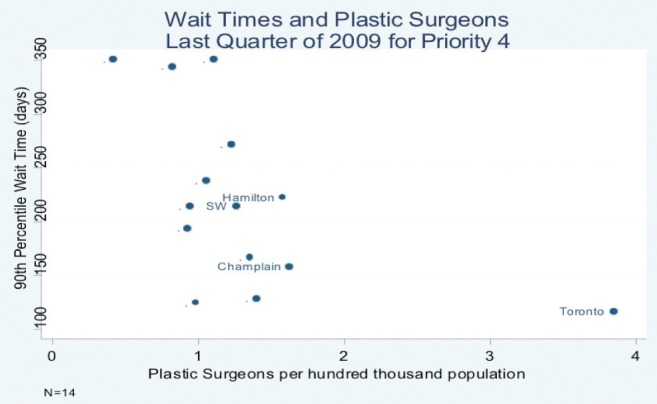
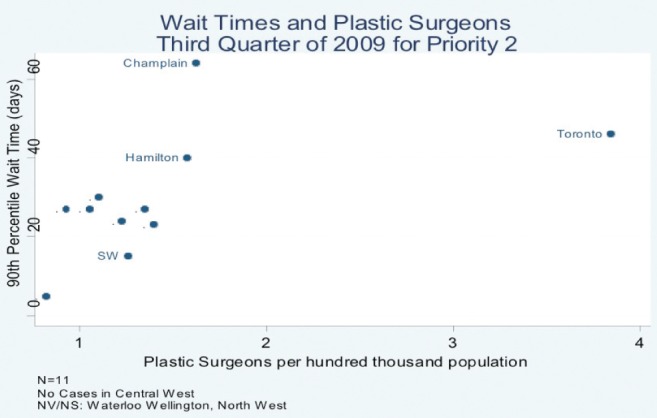
Results: Aggregate plastic surgery wait times at the 90th percentile failed to meet targets based on priority. For priority 2 (target = 28 days) and priority 3 cases (target = 84 days), wait times were 35 and 101 days, respectively (P<0.05). Wait times also consistently exceeded provincial standards in the southwestern (Local Health Integration Network [LHIN] 2), eastern (LHINs 10 and 11) and northeastern (LHIN 13) regions of Ontario. A negative correlation (r=-0.37; P<0.05) between wait times and surgeon density for priority 4 cases was observed, suggesting that more surgeons per capita is associated with shorter wait times for these lower-priority cases. In contrast, a positive correlation was observed for priority 2 (r=0.50; P<0.05) and priority 3 cases (r=0.35; P<0.05).
Conclusion: Plastic surgery wait times in Ontario exceeded benchmarks in several geographical regions. Paradoxically, for high-priority cases, wait times were longer in LHINs with a higher density of plastic surgeons. Further investigation into patient mobility, physician practice patterns and the availability of hospital resources, such as hospital beds or operating room time, is required.
Historique: Il est essentiel de projeter avec précision les besoins en plasticiens pour assurer des normes de soins élevées et bien affecter les ressources. Les chercheurs ont utilisé les données sur les temps d’attente pour déterminer les régions géographiques qui pourraient profiter d’un plus grand nombre de plasticiens.
Méthodologie: Les auteurs ont analysé les temps d’attente en chirurgie plastique à l’aide des données du Système d’information sur les temps d’attente de l’Ontario de 2009 à 2010. Ils ont comparé les résultats avec les normes de référence publiées par la Société canadienne des chirurgiens plasticiens et établi la densité de plasticiens grâce à l’Ontario Physician Human Resources Data Centre.
Résultats: Les temps d’attente regroupés en chirurgie plastique au 90e percentile ne respectaient pas les cibles sur le plan de la priorité. Dans les cas de priorité 2 (cible = 28 jours) et de priorité 3 (cible = 84 jours), les temps d’attente étaient de 35 et de 101 jours, respectivement (P<0,05). De plus, les temps d’attente dépassaient constamment les normes provinciales dans les régions du sud-ouest (réseau local d’intégration des services de santé [RLISS] 2), de l’est (RLISS 10 et 11) et du nord-est (RLISS 13) de l’Ontario. Les chercheurs ont observé une corrélation négative (r=−0,37; P<0,05) entre les temps d’attente et la densité des chirurgiens dans les cas de priorité 4, ce qui laisse supposer qu’un plus grand nombre de chirurgiens per capitas’associe à des temps d’attente plus courts pour ces cas moins prioritaires. Par contre, on observait une corrélation positive dans les cas de priorité 2 (r=0,50; P<0,05) et de priorité 3 (r=0,35; P<0,05).
Conclusion: En Ontario, les temps d’attente en chirurgie plastique dépassent les normes de référence dans plusieurs régions géographiques. Paradoxalement, dans les cas prioritaires, les temps d’attente demeuraient plus longs dans les RLISS où l’on trouvait une plus forte densité de plasticiens. Des recherches plus approfondies s’imposent sur la mobilité des patients, les profils de pratique des médecins et la disponibilité des ressources hospitalières, telles que les lits d’hôpitaux ou les heures en salle d’opération.
Keywords: Number of plastic surgeons; Plastic surgeon workforce; Wait times; Workforce projections.
Figures
Similar articles
-
Ontario wait times for delayed surgical treatment of traumatic peripheral nerve injury.Can J Surg. 2021 Nov 25;64(6):E636-E643. doi: 10.1503/cjs.011920. Print 2021 Nov-Dec. Can J Surg. 2021. PMID: 34824152 Free PMC article.
-
Adequacy of the ophthalmology workforce under Ontario's Local Health Integration Networks.Can J Ophthalmol. 2016 Jun;51(3):142-6. doi: 10.1016/j.jcjo.2015.10.012. Epub 2016 May 11. Can J Ophthalmol. 2016. PMID: 27316258
-
The Impact of COVID-19 on the Surgical Wait Times for Plastic and Reconstructive Surgery in Ontario.Plast Surg (Oakv). 2023 Nov;31(4):338-349. doi: 10.1177/22925503211064381. Epub 2021 Dec 23. Plast Surg (Oakv). 2023. PMID: 37915345 Free PMC article.
-
Challenges and strategies for determining workforce requirements in plastic surgery.Can J Plast Surg. 2012 Winter;20(4):245-7. doi: 10.1177/229255031202000403. Can J Plast Surg. 2012. PMID: 24294019 Free PMC article. Review.
-
The global health workforce shortage: role of surgeons and other providers.Adv Surg. 2008;42:63-85. doi: 10.1016/j.yasu.2008.04.006. Adv Surg. 2008. PMID: 18953810 Review.
Cited by
-
The Canadian Plastic Surgery Workforce Analysis: Forecasting Future Need.Plast Surg (Oakv). 2018 Nov;26(4):269-279. doi: 10.1177/2292550318800328. Epub 2018 Oct 3. Plast Surg (Oakv). 2018. PMID: 30450346 Free PMC article.
-
A Tale of Two Health-Care Systems: Cost-Utility Analysis of Open Carpal Tunnel Release in Canada and the United States.Plast Surg (Oakv). 2017 Feb;25(1):7-13. doi: 10.1177/2292550317693817. Epub 2017 Mar 10. Plast Surg (Oakv). 2017. PMID: 29026806 Free PMC article.
-
An Evaluation of h-Index as a Measure of Research Productivity Among Canadian Academic Plastic Surgeons.Plast Surg (Oakv). 2018 Feb;26(1):5-10. doi: 10.1177/2292550317749508. Epub 2018 Jan 9. Plast Surg (Oakv). 2018. PMID: 29619353 Free PMC article.
References
-
- Kirch DG, Vernon DJ. Confronting the complexity of the physician workforce equation. JAMA. 2008;299:2680–2. - PubMed
-
- Sheldon GF, Schroen AT. Supply and demand: Surgical and health workforce. Surg Clin North Am. 2004;84:1493–509. - PubMed
-
- Weinstein JN, Goodman D, Wennberg JE. The orthopaedic workforce: Which rate is right? JBJS Am. 1998;80:327–30. - PubMed
-
- Wiggins V, Camp M, Petersen G. ASPRS Plastic Surgery Market and Workforce Study. Bryan: RRC Inc; 1994.
-
- Macadam SA, Kennedy S, Lalonde D, Anzarut A, Clarke HM, Brown EE. The Canadian plastic surgery workforce survey: Interpretation and implications. Plast Reconstr Surg. 2007;119:2299–306. - PubMed
LinkOut - more resources
Full Text Sources