. 2013 Nov 14:7:209.
doi: 10.3389/fncel.2013.00209. eCollection 2013.

Dynamics of action potential firing in electrically connected striatal fast-spiking interneurons

Affiliations

Dynamics of action potential firing in electrically connected striatal fast-spiking interneurons

Giovanni Russo et al. Front Cell Neurosci. .

Abstract

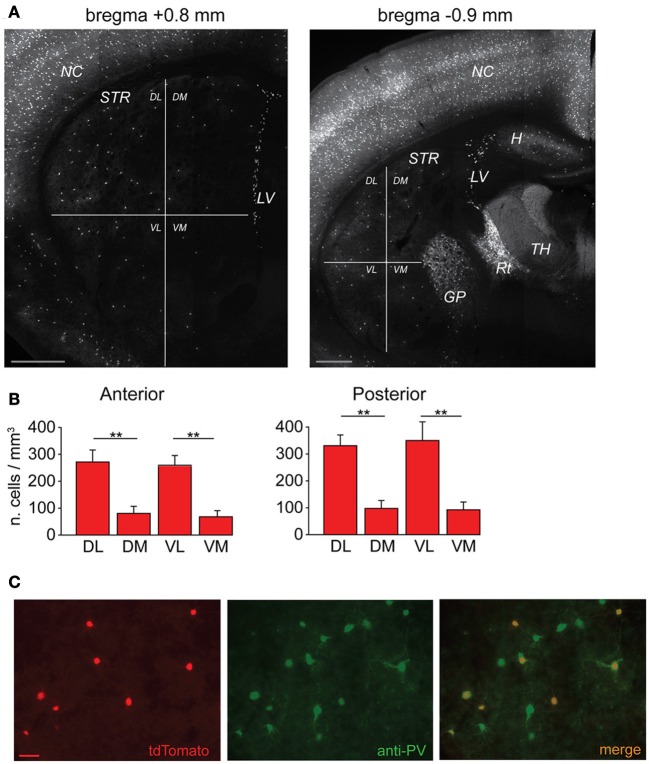
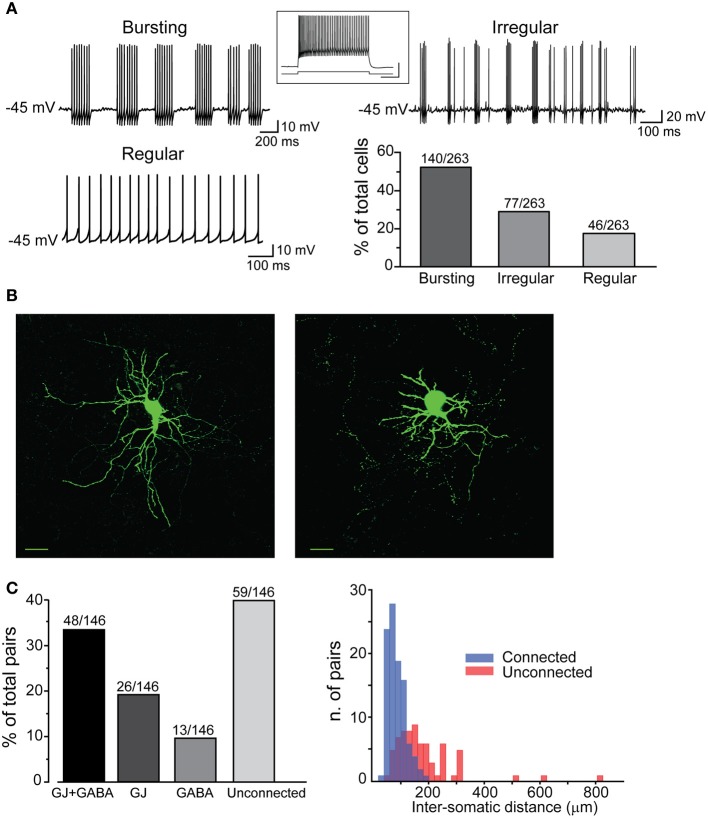
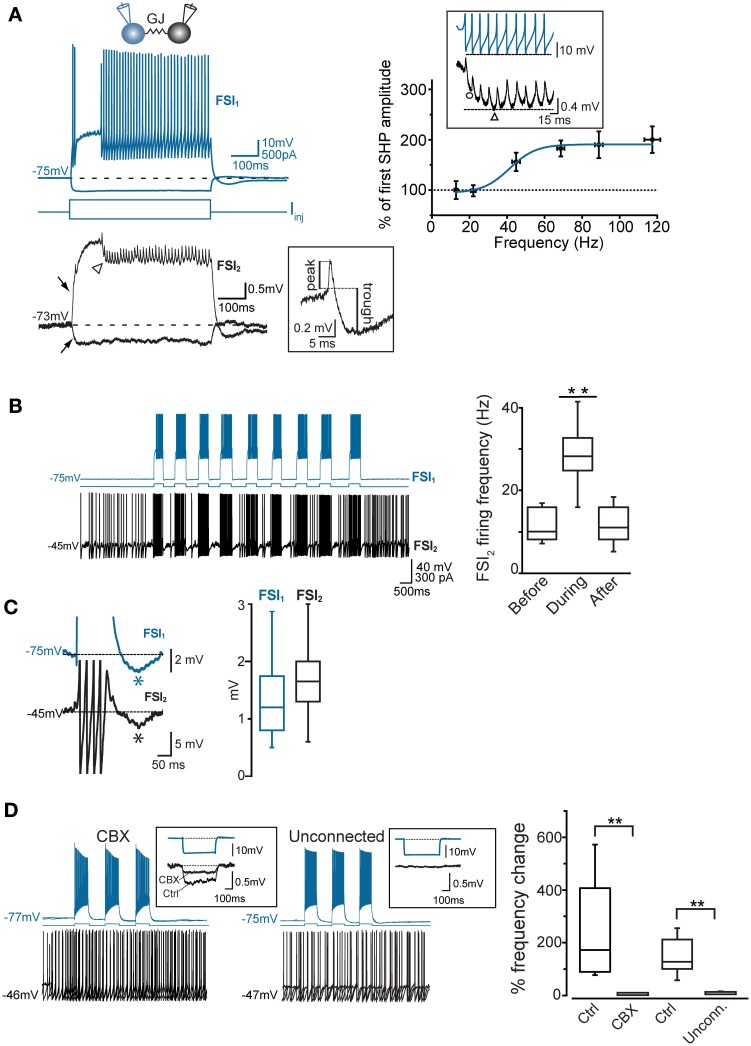
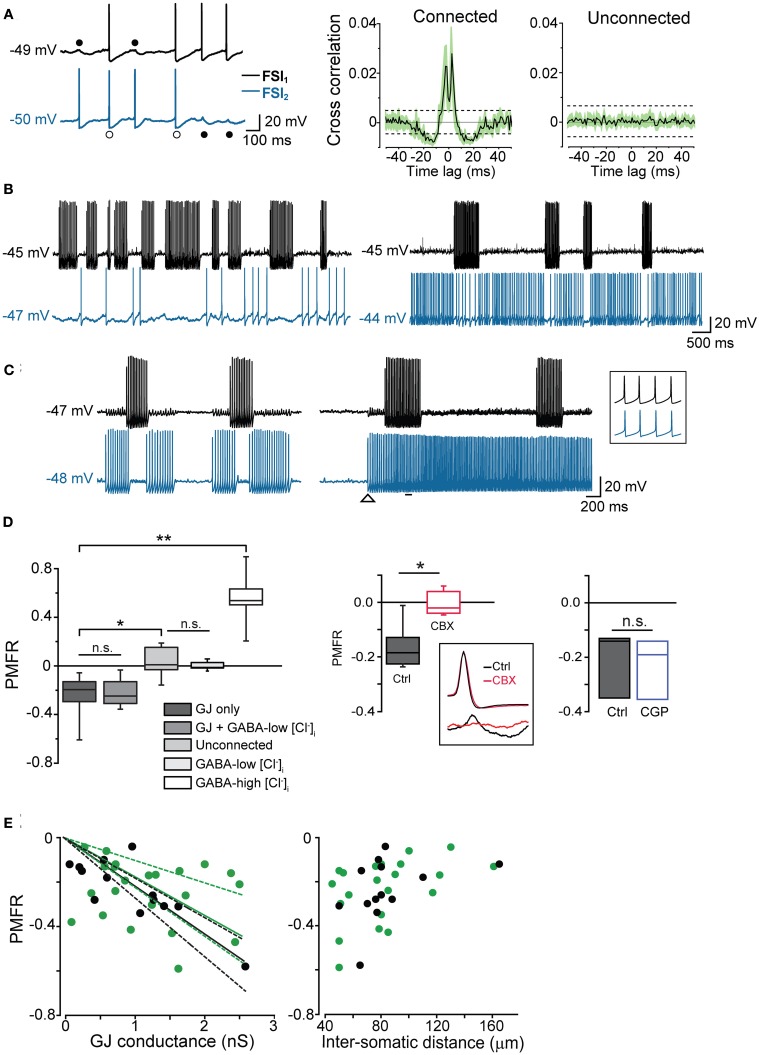
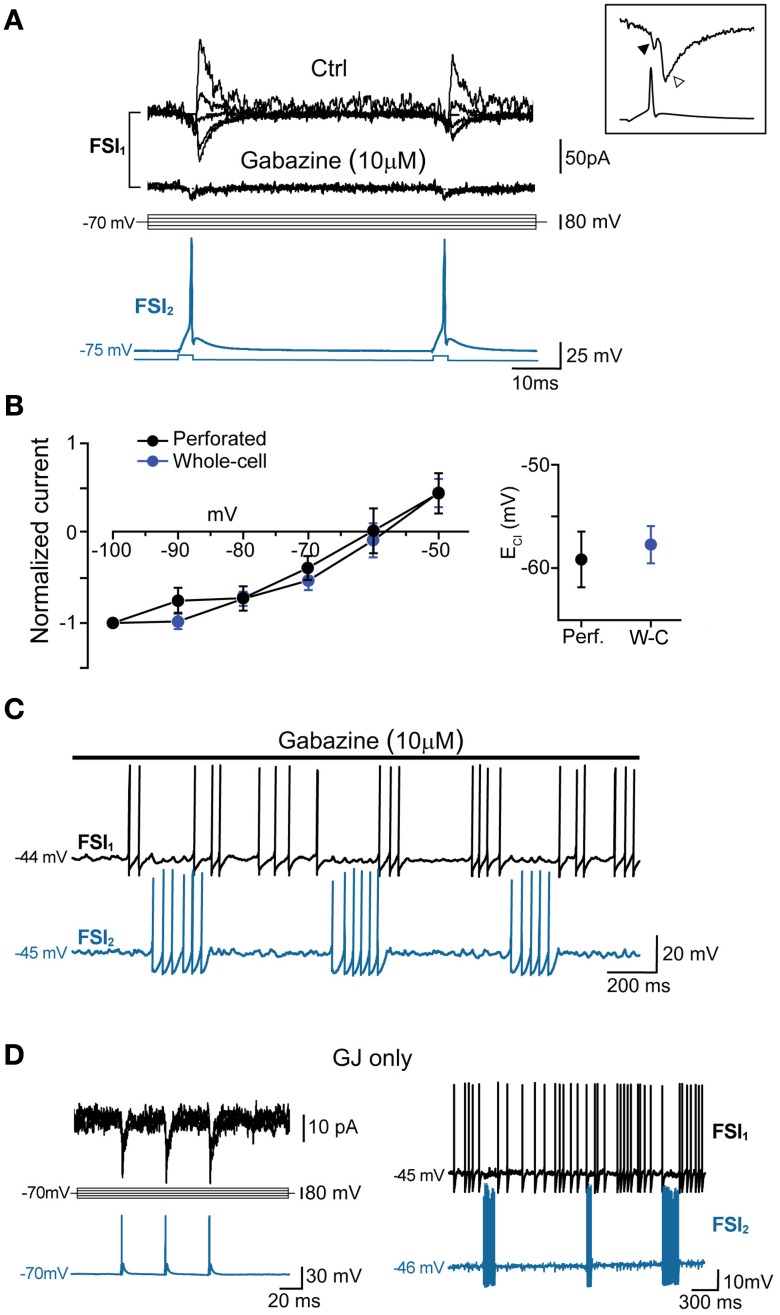
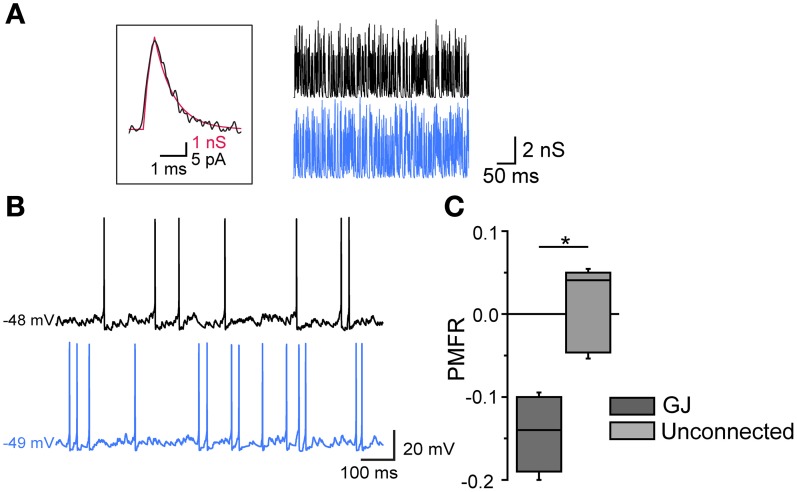
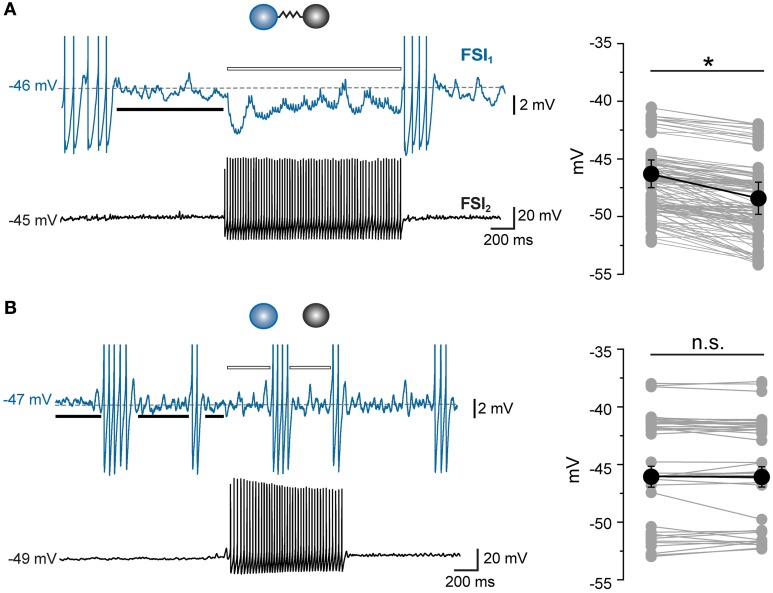
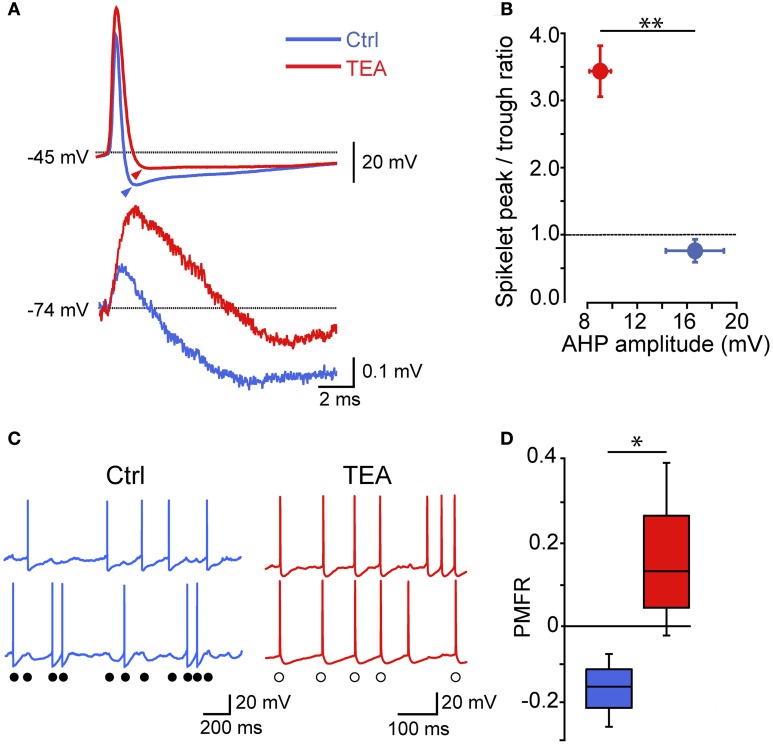
Fast-spiking interneurons (FSIs) play a central role in organizing the output of striatal neural circuits, yet functional interactions between these cells are still largely unknown. Here we investigated the interplay of action potential (AP) firing between electrically connected pairs of identified FSIs in mouse striatal slices. In addition to a loose coordination of firing activity mediated by membrane potential coupling, gap junctions (GJ) induced a frequency-dependent inhibition of spike discharge in coupled cells. At relatively low firing rates (2-20 Hz), some APs were tightly synchronized whereas others were inhibited. However, burst firing at intermediate frequencies (25-60 Hz) mostly induced spike inhibition, while at frequencies >50-60 Hz FSI pairs tended to synchronize. Spike silencing occurred even in the absence of GABAergic synapses or persisted after a complete block of GABAA receptors. Pharmacological suppression of presynaptic spike afterhyperpolarization (AHP) caused postsynaptic spikelets to become more prone to trigger spikes at near-threshold potentials, leading to a mostly synchronous firing activity. The complex pattern of functional coordination mediated by GJ endows FSIs with peculiar dynamic properties that may be critical in controlling striatal-dependent behavior.

Keywords: GABA; action potential; fast-spiking interneurons; gap junctions; striatum.


Figures

Figure 1
Figure 1
Anatomical distribution of striatal FSIs and specificity of parvalbumin expression. (A) PV+-tdTomato-labeled FSIs in mouse acute slices. FSIs were prevalently distributed in the dorsolateral (DL) and ventrolateral (VL) sectors of the striatum (STR) as compared to dorsomedial (DM) and ventromedial (VM) quadrants. Examples of anterior (left) and posterior (right) 50 μm-thick striatal sections are shown (+0.8 mm and −0.9 mm from bregma, respectively). Note the greater density of tdTomato labeled cells in other areas such as neocortex (NC), globus pallidus (GP), reticular thalamic nucleus (Rt) and lateral ventricles (LV), and hippocampus (H), while non-reticular thalamic nuclei (TH) contain densely stained fibers but are almost entirely devoid of tdTomato-labeled cell bodies. Scale bars: 500 μm. (B) Quantification of FSI distribution in the striatum. Data refer to average cell densities per slice ± s.e.m. Counts were made in 50 μm thick slices (n = 19) and grouped according to anterior vs. posterior localization of the relative slice with respect to bregma (see Results). Anterior: n = 8 slices, **p < 0.01 paired t-test; posterior: n = 11 slices, **p < 0.01. (C) Comparison between expression of td-Tomato (left) and anti-PV immunostaining (middle) in a sample area of DL striatum. An overlap of the two images (right) shows that all td-Tomato cells were also PV-immunopositive, while roughly 50% of the PV-immunopositive cells did not express tdTomato. Scale bar: 50 μm.
Figure 2
Figure 2
Electrophysiological properties and connectivity patterns of striatal FSIs. (A) Examples of different firing patterns and relative distributions. Traces are excerpts from 20 to 60 s lasting recordings in which cells were injected with suprathreshold DC (Iinj bursting: 500 pA; regular: 400 pA; irregular: 500 pA). The histogram shows relative distributions of different firing patterns. Inset: high-frequency firing activity in response to supra-threshold current pulse (700 pA, bottom trace). Calibration: 30 mV, 250 ms. (B) Confocal microphotographs showing two different FSIs filled with neurobiotin-488 (scale bars: 20 μm). (C) Left, rates of different connectivity patterns between pairs of striatal FSIs. Right, spatial distribution of connected and unconnected FSI pairs relative to the distance between cell bodies.
Figure 3
Figure 3
Coordination of firing activity in electrically connected FSIs. (A) Top, voltage responses of FSI1 during injection of hyper- and depolarizing current steps (−300 and +400 pA, respectively, 500 ms). Bottom, passive responses mediated by GJ in FSI2 (arrows). Spikelets were elicited in FSI2 during AP firing in FSI1. Note temporal summation of spikelet hyperpolarizing potential (SHP, arrowhead). The inset shows an individual spikelet with reference points used for calculating peak and trough amplitudes. Top right panel, frequency-dependence of SHP temporal summation. Each data point represents the average ratio between the amplitude of the most hyperpolarized SHP (marked by a triangle in the inset lower trace) and the amplitude of the first SHP in the array (circle). To reduce data scattering, ratios were grouped within 15–35 Hz spanning segments along the x-axis (each segment contained 10–15 data points from a total of 38 pairs). A Boltzmann fit of the data set (blue line; see Methods) yielded the following parameters: A1 = 0.95 ± 0.2, A2 = 1.9 ± 0.1, x0 = 41.2 ± 5.4 mV, and dx = 7.0 ± 6.3. Note how spikelet maximal summation was delayed with respect to maximal summation of presynaptic spike AHPs (upper trace in the inset). (B) Left, example of transient, repetitive firing entrainment of two electrically connected FSIs (see text for details). Right, summary of average postsynaptic firing frequencies before, during, and after the injection of current pulses in FSI1 (n = 48 pairs, **p < 0.01, paired-sample t-test). (C) Left, magnified view of individual burst events occurring in two FSIs in response to a suprathreshold current pulse injected in FSI1. Action potential firing was graphically removed in FSI1 and partially truncated in FSI2 in order to emphasize after-hyperpolarization (AHP, marked by asterisks). Right, summary box plots of AHP amplitudes in FSI1 and FSI2. (D) Lack of firing co-activation in response to injection of suprathreshold current pulses in FSI1 (blue) either in the presence of 200 μ M carbenoxolone (CBX) or in unconnected pairs. Insets show Vm changes in FSI2 in response to a hyperpolarizing current pulse (−300 pA, 500 ms) injected in FSI1. The box chart on the right shows a statistical summary relative to frequency changes during current injection in FSI2 in control conditions, after bath application of CBX (n = 8, **p < 0.01, paired t-test) and in connected vs. unconnected pairs (**p < 0.01, unpaired t-test, n = 12).
Figure 4
Figure 4
GJ mediate inhibition in coupled interneurons at high-frequency presynaptic spike firing. (A) In order to induce prolonged episodes of firing activity at low frequency (in this case 8 Hz in both cells), two electrically connected FSIs (without GABAergic synapses) were injected with a relatively small suprathreshold DC (200–250 pA) through the recording electrodes for 1–2 min. Two-second recording segments are shown here starting 5–10 s after the onset of current injection. Left, individual spikes either elicited an AP (white circles) or a spikelet (black circles) in the paired FSI. Right, average cross-correlograms for connected and unconnected pairs (n = 11 and 6, respectively). Shaded areas and dashed lines represent s.e.m. and average confidence intervals equal to two standard deviations of the spike trains, respectively (B) Left, burst-like firing episodes in FSI1 (Iinj: 430 pA; intra-burst frequency: 38 Hz) were associated with silent periods in FSI2 when the latter was stimulated just above firing threshold (Iinj: 310 pA; average spike frequency: 1.8 Hz). Right, in the same pair, FSI2 was injected with stronger DC (Iinj: 370 pA) to increase the firing frequency (~20 Hz). Spike trains in FSI1 were still able to induce a reduction of firing activity in FSI2. (C) Left, spike inhibition resulted in alternated burst firing in two electrically connected FSIs. Right, in the same pair, the inhibitory effect was overrun by a strong increase in firing frequency in FSI2 (from 29 to 52 Hz; Iinj was increased from 380 to 430 pA at the instant indicated by the arrowhead). The inset shows synchronous spikes in a magnified time window indicated by the horizontal bar. (D) Left, box-plot summary of Pearson's mean firing rate coefficient values (PMFR) for connected and unconnected FSI pairs (*p < 0.05, **p < 0.01, n.s.: not significant at p > 0.05, unpaired t-test). Right, box plot summarizing the effect of CBX (200 μ M) and CGP52432 (5 μ M) relative to paired controls (*p < 0.05, n = 5; n.s.: p > 0.05, n = 3, Wilcoxon signed rank test). The inset shows the inhibitory effect of CBX on spikelet (bottom) but not AP waveforms (top). (E) PMFR values plotted against GJ conductance (left) and inter-somatic distance (right) for pairs connected by GJ-only (green circles) and GJ + GABA (black circles). Data sets are the same as the ones used for box plots in (D). Solid lines are linear regression fits of the respective data sets (dashed lines represent confidence bands at 95% level).
Figure 5
Figure 5
GABAA-mediated fast synaptic transmission is not required for spike inhibition. (A) GABAergic IPSCs (top) evoked in FSI1 at various holding potentials (from −100 to −20 mV, 10-mV steps; middle) in response to two consecutive AP elicited in FSI2 at an interval of 50 ms (bottom). In pairs connected by GABAergic synapses, mean peak amplitude, 10–90% rise time, and decay time constant of unitary IPSCs (recorded in voltage-clamp mode at Vclamp = −90 mV) were −70 ± 14 pA, 0.6 ± 0.08 ms, and 3.7 ± 0.5 ms, respectively, while the mean paired-pulse ratio was 0.85 ± 0.05. Bath application of 10 μM gabazine for 5–10 min completely blocked the IPSCs, unmasking small GJ-mediated currents. Inset, magnification of IGJ (black arrowhead) followed by IGABA (white arrowhead) recorded at −100 mV in response to an individual presynaptic AP (bottom trace) (B) Left, current-voltage plots of IPSC amplitudes (mean ± s.e.m.) normalized to average values recorded at −100 mV. Blue and black traces represent data obtained with whole-cell (n = 15) and perforated patch recordings (n = 4), respectively. Right, summary plot of average reversal potentials for Cl ions (ECl) obtained with perforated patch (−59.6 ± 3 mV, n = 4) and whole-cell recordings (−58.2 ± 2 mV; n = 15). The theoretical ECl calculated using the Nernst equation in our experimental conditions was −59 mV (see Methods). (C) Example of spike series in which inhibition is still evident during application of 10 μ M gabazine. (D) Left, voltage-clamp recordings of spikelets alone (i.e., without superimposed IPSCs) at various command potentials in response to three presynaptic AP (blue trace) in a pair connected by GJ, but not GABAergic synapses. Right, mutual inhibition of firing activity recorded in the same pair.
Figure 6
Figure 6
Gap-junction-mediated firing inhibition in FSI pairs stimulated by arrays of sEPSCs in dynamic-clamp configuration. (A) Left, unitary sEPSC conductance (red trace) superimposed to a unitary spontaneous EPSC (black trace) recorded in FSIs in voltage-clamp mode (Vclamp = −70 mV; average of 30 EPSCs recorded in 6 different FSIs). The EPSC waveform was reversed and scaled to that of the sEPSC in order to show matching kinetics (10–90% rise time: 0.3 ms; τdec: 0.85 ms). Right, Poisson trains of sEPSCs (300 Hz, 500 ms; segments excerpted from traces lasting 15–20 s) used as dynamic-clamp waveforms. (B) Action potential firing in two GJ-connected FSIs stimulated by sEPSC trains shown in (A) in the presence of 10 μ M gabazine. (C) Summary of PMFR values for GJ-connected and unconnected FSI pairs (n = 6, *p < 0.05, Mann-Whitney U test).
Figure 7
Figure 7
Gap junctions prevent postsynaptic firing by inducing Vm hyperpolarization at near-threshold levels. (A) Example of a GJ-only connected pair in which FSI1 displayed an array of subthreshold spikelets in response to a train of AP occurring in FSI2 during DC injection in both cells (380 and 405 pA, respectively, 20 s). The average Vm value of FSI1 during the spikelet barrage was measured throughout the duration of FSI2 burst (indicated by the white bar) and compared to the average Vm value before the burst onset (black bar). Right, summary of average Vm values measured in FSI1 before (left column) and during (right column) barrages of 4–8 spikelets occurring in response to AP burst in FSI2. Mean Vm ± s.e.m. values were significantly different in the two conditions (n = 22 pairs, *p < 0.05, paired t-test). (B) Same experiment as in (A), but with non-connected FSIs. Mean Vm ± s.e.m. in FSI1 did not change significantly during a burst in FSI2 (n = 10 pairs, p > 0.05, paired t-test). Transient changes in Vm corresponding to AP firing were excluded from measurements.
Figure 8
Figure 8
The spikelet hyperpolarizing phase is determinant for GJ-mediated spike inhibition: effect of reducing a Kv3 conductance. (A) Individual presynaptic AP (top) and postsynaptic spikelets (bottom) recorded in GJ-connected pairs in control conditions and after bath application of 1 mM TEA. Arrowheads indicate AHP peak levels with respect to spike threshold (marked by dotted line). (B) Summary of spikelet peak/trough ratios plotted against AHP amplitudes (n = 6, **p < 0.01, paired t-test). (C) Examples of AP trains induced by DC injection (300–400 pA) in ctrl (blue) and after bath application of 1 mM TEA (red). Filled circles indicate spike inhibition in control conditions while empty circles mark synchronized spikes after TEA application. (D) Summary of PMFR coefficients switching from negative (ctrl) to positive (TEA) values according to the change in ratio between spikelet peak and trough amplitudes (n = 6, *p < 0.05, paired t-test).

Similar articles

Cited by

References

    1. Bartos M., Vida I., Frotscher M., Meyer A., Monyer H., Geiger J. R., et al. (2002). Fast synaptic inhibition promotes synchronized gamma oscillations in hippocampal interneuron networks. Proc. Natl. Acad. Sci. U.S.A. 99, 13222–13227 10.1073/pnas.192233099 - DOI - PMC - PubMed
    1. Bennett M. V., Zukin R. S. (2004). Electrical coupling and neuronal synchronization in the mammalian brain. Neuron 41, 495–511 10.1016/S0896-6273(04)00043-1 - DOI - PubMed
    1. Berke J. D. (2008). Uncoordinated firing rate changes of striatal fast-spiking interneurons during behavioral task performance. J. Neurosci. 28, 10075–10080 10.1523/JNEUROSCI.2192-08.2008 - DOI - PMC - PubMed
    1. Berke J. D. (2011). Functional properties of striatal fast-spiking interneurons. Front. Syst. Neurosci. 5:45 10.3389/fnsys.2011.00045 - DOI - PMC - PubMed
    1. Blackwell K. T., Czubayko U., Plenz D. (2003). Quantitative estimate of synaptic inputs to striatal neurons during up and down states in vitro. J. Neurosci. 23, 9123–9132 - PMC - PubMed

LinkOut - more resources