

Awareness of implicit attitudes
- PMID: 24294868
- PMCID: PMC4038711
- DOI: 10.1037/a0035028
Awareness of implicit attitudes
Abstract
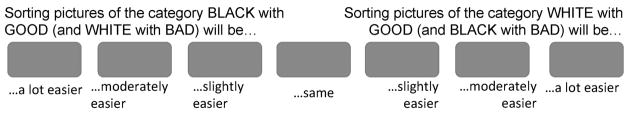
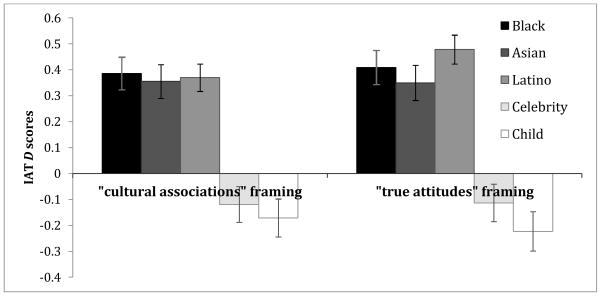
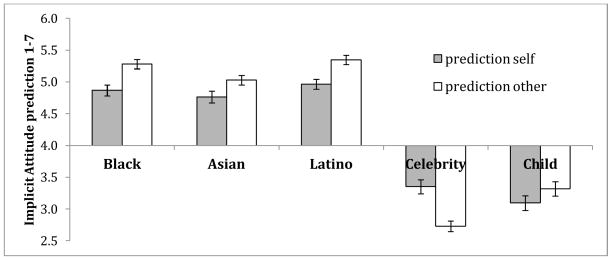
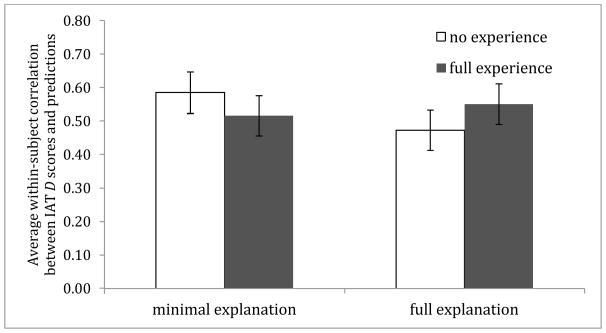
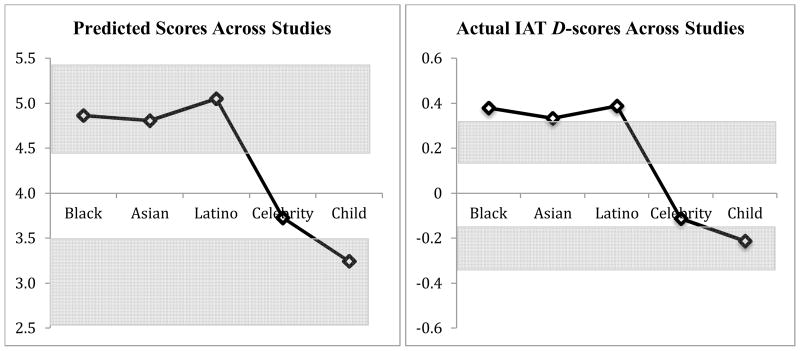
Research on implicit attitudes has raised questions about how well people know their own attitudes. Most research on this question has focused on the correspondence between measures of implicit attitudes and measures of explicit attitudes, with low correspondence interpreted as showing that people have little awareness of their implicit attitudes. We took a different approach and directly asked participants to predict their results on upcoming Implicit Association Test (IAT) measures of implicit attitudes toward 5 social groups. We found that participants were surprisingly accurate in their predictions. Across 4 studies, predictions were accurate regardless of whether implicit attitudes were described as true attitudes or culturally learned associations (Studies 1 and 2), regardless of whether predictions were made as specific response patterns (Study 1) or as conceptual responses (Studies 2-4), and regardless of how much experience or explanation participants received before making their predictions (Study 4). Study 3 further suggested that participants' predictions reflected unique insight into their own implicit responses, beyond intuitions about how people in general might respond. Prediction accuracy occurred despite generally low correspondence between implicit and explicit measures of attitudes, as found in prior research. Altogether, the research findings cast doubt on the belief that attitudes or evaluations measured by the IAT necessarily reflect unconscious attitudes.
PsycINFO Database Record (c) 2014 APA, all rights reserved.
Figures
References
-
- Agerström J, Rooth DO. The role of automatic obesity stereotypes in real hiring discrimination. Journal of Applied Psychology. 2011;96(4):790–805. - PubMed
-
- Asendorpf JB, Banse R, Mücke D. Double dissociation between implicit and explicit personality self-concept: The case of shy behavior. Journal of Personality and Social Psychology. 2002;83:380–393. - PubMed
-
- Banaji MR. Implicit attitudes can be measured. In: Roediger HL, Nairne JS, Neath I, Surprenant A, editors. The nature of remembering: Essays in remembering Robert G. Crowder. Washington, DC: American Psychological Association; 2001. pp. 117–150.
-
- Banaji MR, Heiphetz L. Attitudes. In: Fiske ST, Gilbert DT, Lindzey G, editors. Handbook of Social Psychology. New York: John Wiley & Sons; 2010. pp. 348–388.
-
- Banse R, Seise J, Zerbes N. Implicit attitudes towards homosexuality: Reliability, validity, and controllability of the IAT. Zeitschrift für Experimentelle Psychologie. 2001;48:145–160. - PubMed
Publication types
MeSH terms
Grants and funding
LinkOut - more resources
Full Text Sources
Other Literature Sources
Miscellaneous
