. 2014 Aug 1;21(4):533-50.
doi: 10.1089/ars.2012.5129. Epub 2014 Feb 6.

NADPH oxidase 1, a novel molecular source of ROS in hippocampal neuronal death in vascular dementia

Affiliations

NADPH oxidase 1, a novel molecular source of ROS in hippocampal neuronal death in vascular dementia

Dong-Hee Choi et al. Antioxid Redox Signal. .

Abstract

Aims: Chronic cerebral hypoperfusion (CCH) is a common pathological factor that contributes to neurodegenerative diseases such as vascular dementia (VaD). Although oxidative stress has been strongly implicated in the pathogenesis of VaD, the molecular mechanism underlying the selective vulnerability of hippocampal neurons to oxidative damage remains unknown. We assessed whether the nicotinamide adenine dinucleotide phosphate (NADPH) oxidase (Nox) complex, a specialized superoxide generation system, plays a role in VaD by permanent ligation of bilateral common carotid arteries in rats.

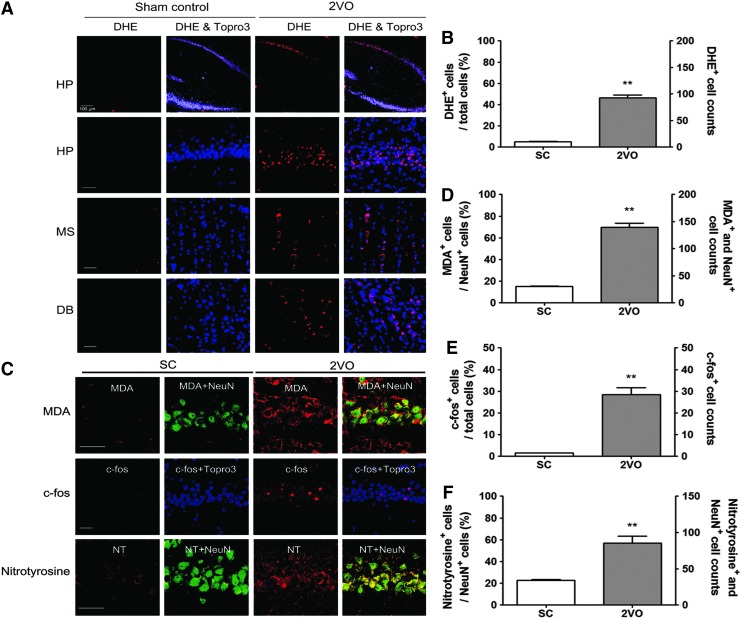
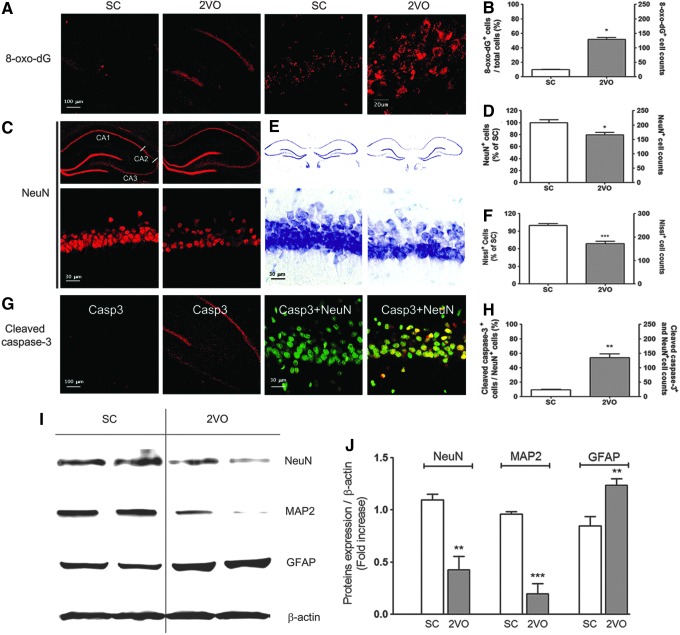
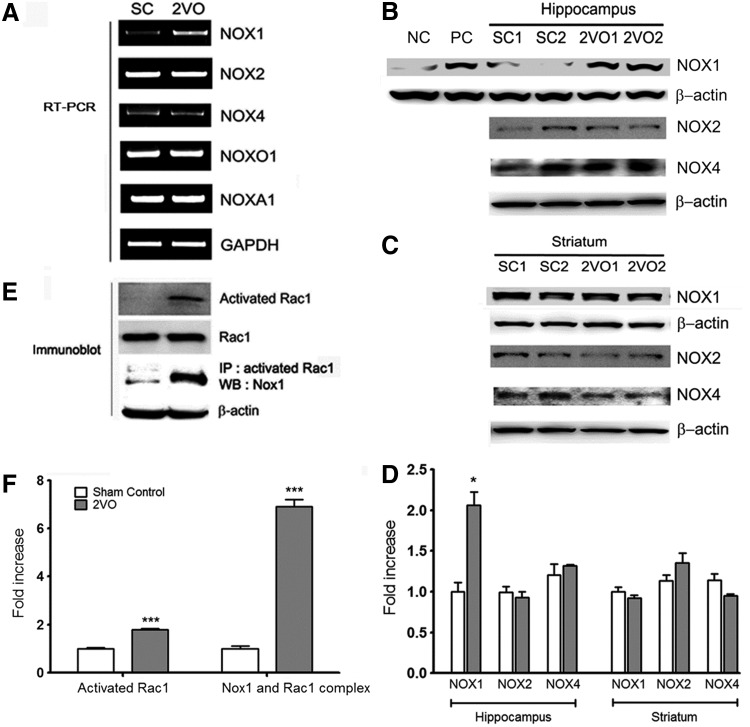
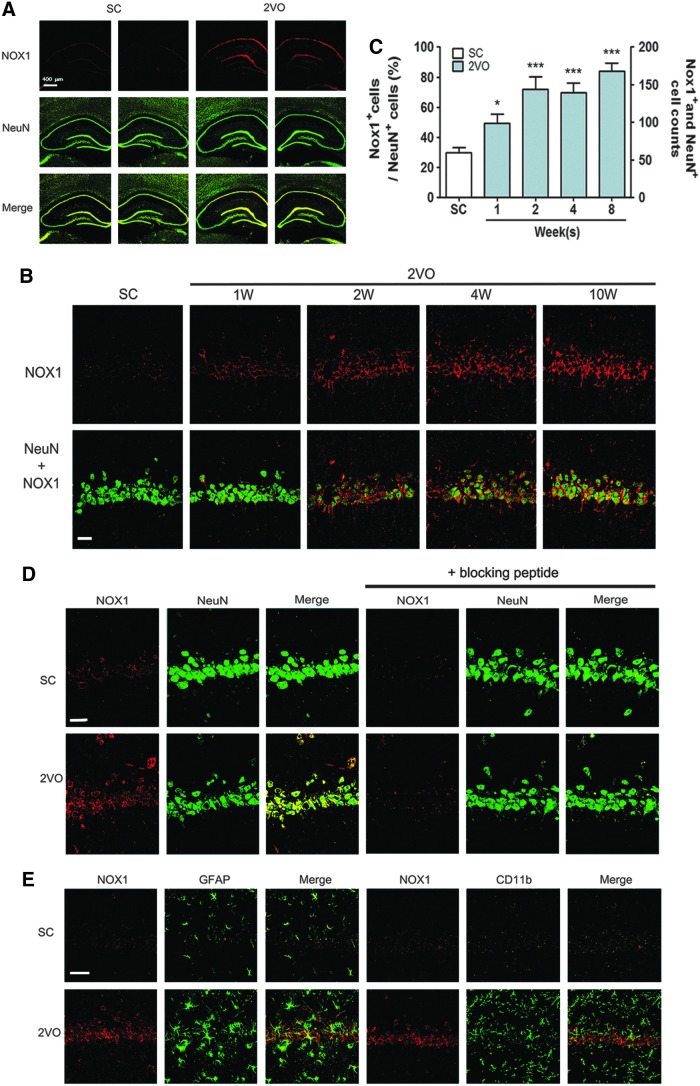
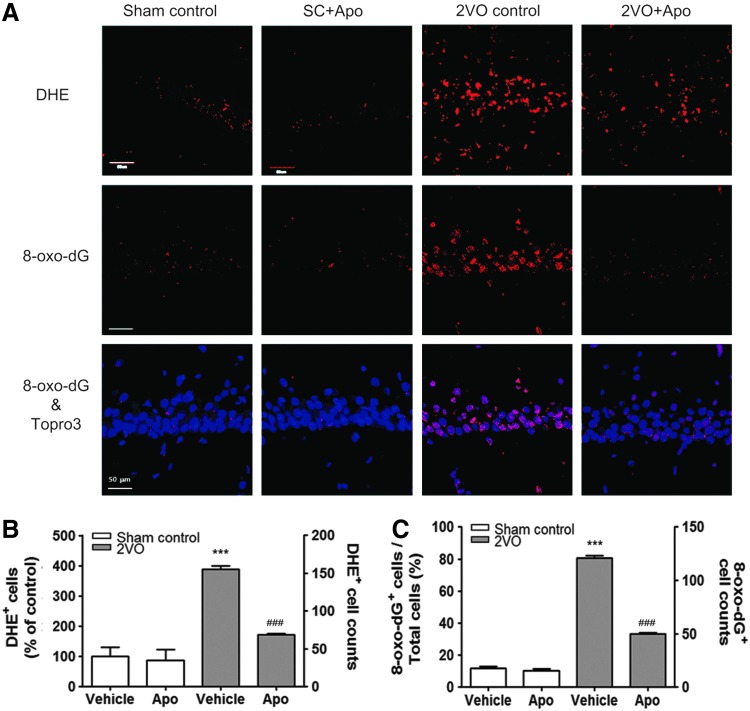
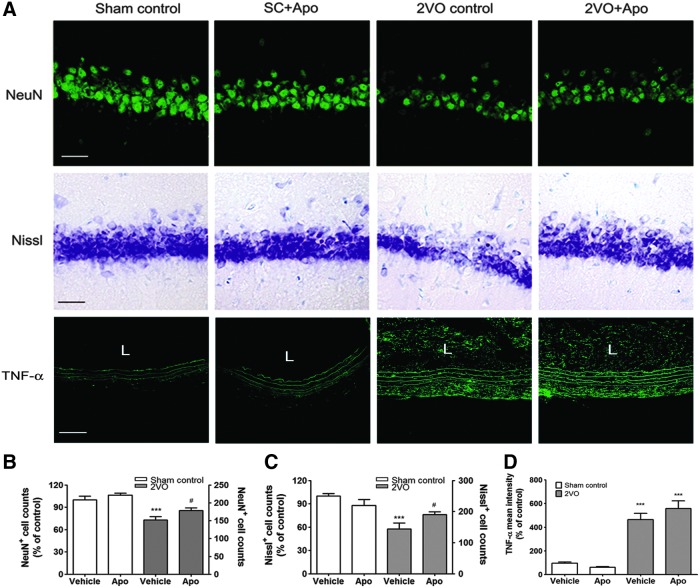
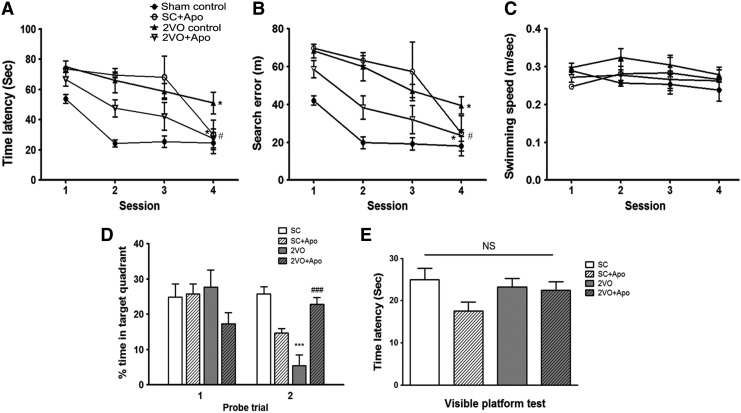
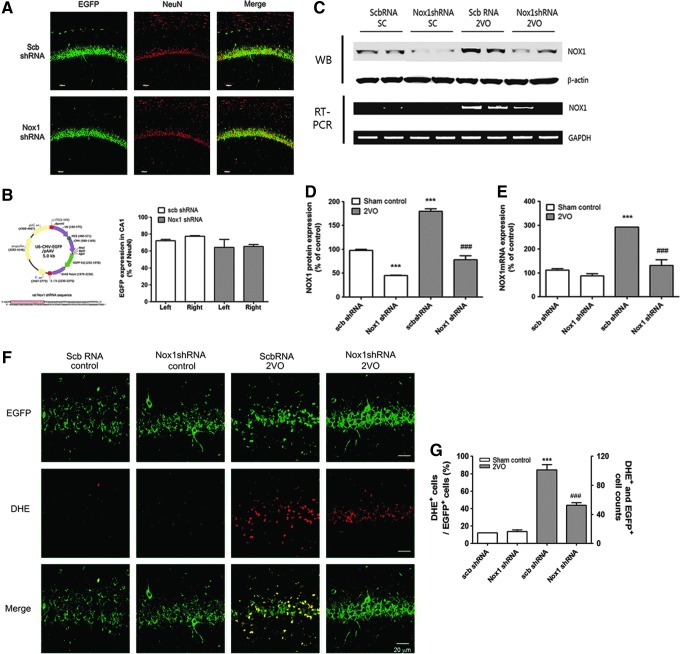
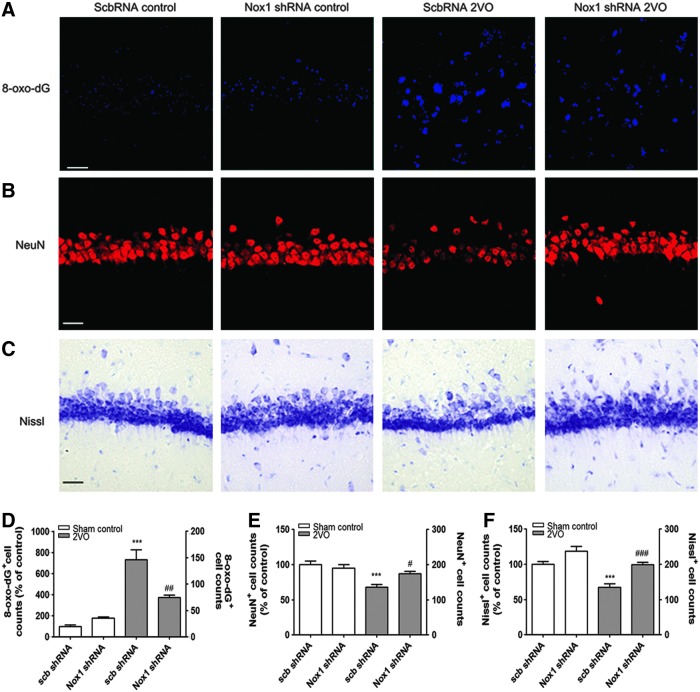
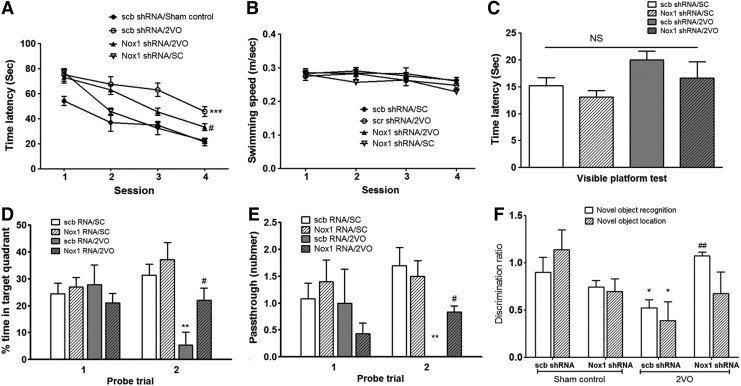
Results: Male Wistar rats (10 weeks of age) were subjected to bilateral occlusion of the common carotid arteries (two-vessel occlusion [2VO]). Nox1 expression gradually increased in hippocampal neurons, starting at 1 week after 2VO and for approximately 15 weeks after 2VO. The levels of superoxide, DNA oxidation, and neuronal death in the CA1 subfield of the hippocampus, as well as consequential cognitive impairment, were increased in 2VO rats. Both inhibition of Nox by apocynin, a putative Nox inhibitor, and adeno-associated virus-mediated Nox1 knockdown significantly reduced 2VO-induced reactive oxygen species generation, oxidative DNA damage, hippocampal neuronal degeneration, and cognitive impairment.

Innovation and conclusion: We provided evidence that neuronal Nox1 is activated in the hippocampus under CCH, causing oxidative stress and consequential hippocampal neuronal death and cognitive impairment. This evidence implies that Nox1-mediated oxidative stress plays an important role in neuronal cell death and cognitive dysfunction in VaD. Nox1 may serve as a potential therapeutic target for VaD.


Figures

<b>FIG. 1.</b>
FIG. 1.
Increased superoxide generation in the hippocampus (HP) of 2VO-operated rats. (A) Representative fluorescence micrographs of superoxide production as visualized by ethidium fluorescence (red) in the HP and the medial septal nucleus (MS), and diagonal band (DB) at 10 weeks post-2VO operation. Scale bars=30 μm. (B) Changes in the % DHE (red) stained neurons of total cells and the number of DHE-stained neurons of Topro3 (nuclear marker, blue)-stained cells in the hippocampal CA1 subfield after sham- and 2VO operation in rats (n=4 per group, Error bars indicate SE). **p<0.01 versus Sham-operated rats. (C) Representative images of tissue sections immunostained with MDA, c-fos, or nitrotyrosine from rat hippocampal CA1 taken from sham-operated group (Sham control, n=4) and 2VO group (n=4) at 10 weeks after operation. (D) Changes in the % MDA (red)-stained neurons of NeuN (green)-stained cells and the number of MDA and NeuN-stained neurons in the hippocampal CA1 subfield after sham- and 2VO operation in rats (n=4 per group, Error bars indicate SE). MDA expression in NeuN+ neurons is demonstrated as yellow staining after merging green (NeuN) and red (DHE) images. **p<0.01 versus Sham-operated rats. (E) Changes in the % c-fos (red)-stained neurons of Topro3 (blue) stained cells and the number of c-fos-stained neurons of total neurons in the hippocampal CA1 subfield after sham- and 2VO operation in rats (n=4 per group, Error bars indicate SE). **p<0.01 versus Sham-operated rats. (F) Changes in the % nitrotyrosine (red)-stained neurons of NeuN (green)-stained cells and the number of nitrotyrosine and NeuN-stained neurons in the hippocampal CA1 subfield after sham- and 2VO operation in rats (n=4 per group, Error bars indicate SE). **p<0.01 versus sham-operated rats. Nitrotyrosine expression in NeuN+ neurons is demonstrated as yellow staining after merging green (NeuN) and red (DHE) images. Scale bars=30 μm. 2VO, two-vessel occlusion; DHE, dihydroethidium; MDA, malondialdehyde; NT, nitrotyrosine To see this illustration in color, the reader is referred to the web version of this article at www.liebertpub.com/ars
<b>FIG. 2.</b>
FIG. 2.
Increased neuronal death in the hippocampus of 2VO-operated rats. (A) Representative fluorescence micrographs of DNA oxidation as visualized by 8-oxo-dG immunoreactivity (red) in the hippocampus (HP) at 10 weeks post-2VO operation. (B) Changes in the % by 8-oxo-dG (red)-stained neurons in the hippocampal CA1 subfield after sham- and 2VO operation in rats (n=4 per group, Error bars indicate SE). *p<0.05 versus Sham-operated rats. Representative images of tissue sections immunostained with NeuN (C), stained with Cresyl violet (E), and immunostained with cleaved caspase-3 (G) from rat hippocampal CA1 taken from sham-operated group (Sham control, n=4) and 2VO group (n=4) at 10 weeks after operation. (D) Changes in the % NeuN (red)-stained neurons of sham control and the number of NeuN (red)-stained neurons in the hippocampal CA1 subfield after sham- and 2VO operation in rats (n=4 per group, Error bars indicate SE). *p<0.05 versus sham-operated rats. (F) Changes in the % Cresyl violet-stained neurons of sham control and the number of Cresyl violet-stained neurons in the hippocampal CA1 subfield after sham- and 2VO operation in rats (n=4 per group, Error bars indicate SE). ***p<0.001 versus sham-operated rats. (H) Changes in the % cleaved caspase-3 (red)-stained neurons of NeuN (green)-stained cells and the number of cleaved caspase-3 and NeuN-stained neurons (yellow) in the hippocampal CA1 subfield after sham- and 2VO operation in rats (n=4 per group, Error bars indicate SE). **p<0.01 versus sham-operated rats. (I) Western blot analysis showing NeuN, MAP-2, and GFAP levels in the HP of the sham control (n=3) or 2VO group (n=3) at 10 weeks after operation. (J) The intensity of each band was densitometrically determined and normalized against β-actin. NeuN and MAP-2 levels were statistically decreased in 2VO-operated rats (n=3, **p<0.01 and ***p<0.001 vs. sham-operated rats). GFAP level significantly increased in 2VO-operated rats. 8-oxo-dG, 8-hydroxy-2′-deoxyguanosine; GFAP, glial fibrillary acidic protein. To see this illustration in color, the reader is referred to the web version of this article at www.liebertpub.com/ars
<b>FIG. 3.</b>
FIG. 3.
Increased expressions of Nox1 mRNA and Nox1 proteins and Rac1 activation in the hippocampus of 2VO-operated rats. (A) A representative PCR of Nox1 mRNA in hippocampus of 2VO-operated rats at 2 weeks after operation. (B, C) Representative photomicrographs of Western blot analysis showing Nox1, Nox2, and Nox4 levels in the hippocampus and striatum of rats 2 weeks after the rats were subjected to SC and 2VO operations. To verify Nox1 antibody specificity, total lysates of the SN tissues of rats injected with 6-OHDA or vehicle were used as a positive or negative control, respectively. NC, negative control; PC, positive control. (D) The intensity of each band was densitometrically determined and normalized against β-actin. Nox1 expression was significantly increased in hippocampus of 2VO-operated rats (n=3, *p<0.01 vs. Sham control). (E) The activated fraction of Rac1 was determined in the hippocampus of SC and 2VO-operated rats with the active GTPase pull-down assay. Rac1 levels were measured as an internal control. After GTPase pull-down, Nox1 was detected using Western blot analysis on the same blot to determine binding with activated Rac1 and Nox1. (F) The intensity of each band was densitometrically determined and normalized against Rac1 or β-actin. Rac1 activation and binding with activated Rac1 and Nox1 were significantly increased in hippocampus of 2VO-operated rats (n=3, ***p<0.001 vs. Sham control). 6-OHDA, 6-hydroxydopamine; NADPH, nicotinamide adenine dinucleotide phosphate; Nox1, NADPH oxidase 1; PCR, polymerase chain reaction; SN, substantia nigra.
<b>FIG. 4.</b>
FIG. 4.
Increased expression of neuronal Nox1 in the hippocampal tissues of 2VO-operated rats. (A, D) Representative photographs of tissue sections stained with Nox1 (Red) and NeuN (green) antibody from rat hippocampal CA1 taken from sham-operated group (SC, n=4) and 2VO (n=4)-operated rats at 10 weeks after the operation. Nox1 expression in NeuN+ neurons is demonstrated as yellow staining after merging green (NeuN) and red (Nox1) images. (B) Representative photographs of tissue sections stained with Nox1 (red) and NeuN (green) antibody from rat hippocampal CA1 taken from sham-operated group (SC, n=4) and 2VO (n=4)-operated rats at 1, 2, 4, and 10 weeks after the operation. Nox1 expression in NeuN+ neurons is demonstrated as yellow staining after merging green (NeuN) and red (Nox1) images. (C) Changes in the % Nox1 (red)-stained neurons of NeuN (green)-stained cells and the number of Nox1(red) and NeuN (green)-stained neurons (yellow) in the hippocampal CA1 subfield after sham- and 2VO operation in rats (n=4 per group, Error bars indicate SE). *p<0.05, ***p<0.001 versus sham-operated rats. (D) Representative photographs of disappearance of Nox1 staining (red) in hippocampal tissue sections after antibody absorption with blocking peptide. Nox1 antibody specificity was evaluated by preincubation with specific blocking peptide for 1 h. (E) Nox1 (red) expression was observed neither in astrocytes nor in microglia (n=4). GFAP (green) and CD11b (green) were stained as markers for astrocytes and microglia, respectively (n=4). Scale bars=30 μm. To see this illustration in color, the reader is referred to the web version of this article at www.liebertpub.com/ars
<b>FIG. 5.</b>
FIG. 5.
Increased superoxide generation and DNA oxidation in hippocampal neurons of 2VO-operated rats attenuated by apocynin. (A) Representative fluorescence micrographs of superoxide production as visualized by ethidium fluorescence (DHE, red) and 8-oxo-dG immunoreactivity (red) at 10 weeks post-2VO operation. (B) Increased % DHE (red)-stained neurons of sham control and the number of DHE-stained neurons in 2VO-operated rats treated with vehicle were significantly decreased by apocynin treatment. (n=6, ***p<0.001 vs. sham-operated rats treated with vehicle, ###p<0.001 vs. 2VO-operated rats treated with vehicle). (C) Increased % of 8-oxo-dG (red)-stained neurons of Topro3 (blue)-stained cells and the number of 8-oxo-dG (red)-stained neurons in 2VO-operated rats treated with vehicle were significantly decreased by apocynin treatment. (n=6, ***p<0.001 vs. sham-operated rats treated with vehicle, ###p<0.001 vs. 2VO-operated rats treated with vehicle). Sham control, sham-operated rats treated with vehicle; SC+Apo, sham-operated rats treated with apocynin (10 mg/kg/day for 8 weeks); 2VO control, 2VO-operated rats treated with vehicle; 2VO+Apo, 2VO-operated rats treated with apocynin. To see this illustration in color, the reader is referred to the web version of this article at www.liebertpub.com/ars
<b>FIG. 6.</b>
FIG. 6.
Hippocampal neuronal loss in 2VO-operated rats is attenuated by apocynin. (A) Representative photographs of tissue sections stained with the NeuN (green) antibody, Cresyl violet, or TNF-α (green) antibody from rat hippocampal CA1 and common carotid artery taken from the sham-operated group (Sham control, n=6) and 2VO group (n=6) with or without apocynin. Scale bars=30 μm (upper and middle panel), 50 μm (lower panel). (B, C) Decreased NeuN- and Nissl-positive cell counts in 2VO-operated rats treated with vehicle were significantly decreased by apocynin treatment. (n=6, ***p<0.001 vs. sham-operated rats treated with vehicle, #p<0.05 versus 2VO-operated rats treated with vehicle). (D) Increased mean intensity of TNF-α expression in neointima and tunica media of ligated common carotid artery was not decreased by apocynin treatment at 4 weeks after 2VO operation (n=6, ***p<0.001 vs. sham-operated rats treated with vehicle). Sham control, sham-operated rats treated with vehicle; SC+Apo, sham-operated rats treated with apocynin (10 mg/kg/day for 8 weeks); 2VO control, 2VO-operated rats treated with vehicle; 2VO+Apo, 2VO-operated rats treated with apocynin; L, lumen; TNF-α, tumor necrosis factor alpha. To see this illustration in color, the reader is referred to the web version of this article at www.liebertpub.com/ars
<b>FIG. 7.</b>
FIG. 7.
Effect of apocynin on chronic cerebral hypoperfusion-induced Morris water maze (MWM) performance deficits in rats. Spatial memory evaluation using time latency (A), search error (B), swimming speed (C) % time in target quadrant (D), and (E) time latency in visible platform test. n=6/group, *p<0.05, ***p<0.001 versus Sham control, #p<0.05, ###p<0.001 versus 2VO control. Sham control, sham-operated rats treated with vehicle; SC+Apo, sham-operated rats treated with apocynin (10 mg/kg/day for 8 weeks); 2VO control, 2VO-operated rats treated with vehicle; 2VO+Apo, 2VO-operated rats treated with apocynin; NS, not significant.
<b>FIG. 8.</b>
FIG. 8.
The transduction efficiency of scramble shRNA or Nox1 shRNA expression in hippocampal neurons and reduced superoxide generation by Nox1 knockdown in 2VO rats. (A) Representative photographs of tissue sections expressed EGFP (green) and stained with the NeuN (red) antibody from rat hippocampal CA1 taken from rats at 4 weeks after scramble shRNA/AAV2 or Nox1 shRNA/AAV2 injection. shRNA expression in NeuN+ neurons is demonstrated as yellow staining after merging green (EGFP) and red (NeuN) images. (B) Establishment of U6 promoter-based Nox1 shRNA/AAV vector. U6 promoter-driven shRNA expression system was established in AAV vector. EGFP expression is separately controlled by a CMV promoter as a marker for the transduction efficiency. Nox1 shRNA sequence was designed based on the siRNA sequence (boxed red nucleotides). EGFP expression levels were measured as % volume of EGFP expression in NeuN+ neurons in both hippocampal CA1 subfields. Left: left hemisphere of brain; Right: right hemisphere of brain. (C–E) Nox1 knockdown efficiency in the hippocampal CA1 subfield was verified by both Western blot analysis and RT-PCR performed at 12 weeks after AAV2 injection. n=4/group, ***p<0.001 versus Sham control with scramble RNA/AAV2, ###p<0.001 versus 2VO control with scramble RNA/AAV2. Scb, scramble (F) AAV particles containing scramble shRNA or Nox1 shRNA were stereotaxically injected into the rat hippocampal CA1 subfield. After 4 weeks of incubation, animals were subject to either sham or 2VO operation. Fifteen weeks later, hippocampal CA1 subfields were visualized with DHE (red) for superoxide detection (n=5/group). Cells expressing EGFP (green) represent AAV-transduced cells. shRNA expression in NeuN+ neurons is demonstrated as yellow staining after merging green (EGFP) and red (NeuN) images. (G) Increased % of DHE-stained cells in EGFP-expressed cells and the number of DHE- and EGFP-positive cells in 2VO-operated rats injected with scrambled shRNA were significantly decreased by Nox1 knockdown. (n=5, ***p<0.001 vs. Scb RNA control, ###p<0.001 vs. ScbRNA 2VO). Scb RNA control, Sham-operated rats injected with scramble shRNA AAV particles; Nox1 shRNA control, Sham-operated rats injected with Nox1 shRNA AAV particles; ScbRNA 2VO, 2VO-operated rats injected with scramble shRNA AAV particles; Nox1 shRNA 2VO, 2VO-operated rats injected with Nox1 shRNA AAV particles. Scale bar=20 μm. AAV2, adeno-associated virus serotype 2; EGFP, enhanced green fluorescent protein; RT-PCR, reverse transcription–polymerase chain reaction. To see this illustration in color, the reader is referred to the web version of this article at www.liebertpub.com/ars
<b>FIG. 9.</b>
FIG. 9.
Increased DNA oxidation and neuronal loss in the hippocampal neurons of 2VO-operated rats attenuated by Nox1 knockdown. Representative photographs of tissue sections stained with (A) 8-oxo-dG (blue), (B) NeuN (red) antibody, and (C) Cresyl violet from rat hippocampal CA1 taken from sham-operated group (Sham control) and 2VO group with scramble (scb) shRNA or Nox1 shRNA (n=5/group). (D) Increased DNA oxidation (8-oxo-dG-positive cells) was significantly decreased by Nox1 knockdown (n=5, ***p<0.001 vs. scb shRNA control; ##p<0.01 vs. scb shRNA 2VO). (E, F) Decreased NeuN- or Nissl-positive cell counts were statistically recovered by Nox1 knockdown (n=5, ***p<0.001 vs. sham control with scb shRNA; #p<0.05 and ###p<0.001 vs. 2VO with scb shRNA). Scb RNA control, Sham-operated rats injected with scramble shRNA AAV particles; Nox1 shRNA control, Sham-operated rats injected with Nox1 shRNA AAV particles; ScbRNA 2VO, 2VO-operated rats injected with scramble shRNA AAV particles; Nox1 shRNA 2VO, 2VO-operated rats injected with Nox1 shRNA AAV particles. Scale bar=20 μm. To see this illustration in color, the reader is referred to the web version of this article at www.liebertpub.com/ars
<b>FIG. 10.</b>
FIG. 10.
Inhibition of Nox1 reduced the memory impairment in 2VO rats. The MWM test was employed to evaluate spatial memory. (A) time latency, (B) swimming speed, (C) time latency in visible platform test, (D) % time in target quadrant, and (E) number of passes through the platform were measured. (F) The novel object recognition and location test were performed at 13 weeks after 2VO. Exploratory time spent for novel objects was recorded, and the discrimination ratio was calculated. n=10/group, *p<0.05, **p<0.01, ***p<0.001 versus scb shRNA/Sham control; #p<0.05 versus scb shRNA/2VO. Time latency in visible platform test (C) was not different among groups. scb shRNA/Sham control, Sham-operated rats injected with scramble shRNA AAV particles; scb shRNA/2VO, 2VO-operated rats injected with scramble shRNA AAV particles; Nox1 shRNA/2VO, 2VO-operated rats injected with Nox1 shRNA AAV particles; Nox1 shRNA/SC, sham-operated rats injected with Nox1 shRNA AAV particles.

References

    1. Abramov AY, Jacobson J, Wientjes F, Hothersall J, Canevari L, and Duchen MR. Expression and modulation of an NADPH oxidase in mammalian astrocytes. J Neurosci 25: 9176–9184, 2005 - PMC - PubMed
    1. Aggarwal NT. and Decarli C. Vascular dementia: emerging trends. Semin Neurol 27: 66–77, 2007 - PubMed
    1. Aliev G, Smith MA, Obrenovich ME, de la Torre JC, and Perry G. Role of vascular hypoperfusion-induced oxidative stress and mitochondria failure in the pathogenesis of Azheimer disease. Neurotox Res 5: 491–504, 2003 - PubMed
    1. Barone E, Di Domenico F, Cenini G, Sultana R, Cini C, Preziosi P, Perluigi M, Mancuso C, and Butterfield DA. Biliverdin reductase—a protein levels and activity in the brains of subjects with Alzheimer disease and mild cognitive impairment. Biochim Biophys Acta 1812: 480–487, 2011 - PMC - PubMed
    1. Barone E, Di Domenico F, Cenini G, Sultana R, Coccia R, Preziosi P, Perluigi M, Mancuso C, and Butterfield DA. Oxidative and nitrosative modifications of biliverdin reductase-A in the brain of subjects with Alzheimer's disease and amnestic mild cognitive impairment. J Alzheimers Dis 25: 623–633, 2011 - PubMed

Publication types

MeSH terms

LinkOut - more resources