Review
. 2014 Jan;15(1):22-33.
doi: 10.1038/nrg3627. Epub 2013 Dec 3.

Epistasis and quantitative traits: using model organisms to study gene-gene interactions

Affiliations
Review

Epistasis and quantitative traits: using model organisms to study gene-gene interactions

Trudy F C Mackay. Nat Rev Genet. 2014 Jan.

Abstract

The role of epistasis in the genetic architecture of quantitative traits is controversial, despite the biological plausibility that nonlinear molecular interactions underpin the genotype-phenotype map. This controversy arises because most genetic variation for quantitative traits is additive. However, additive variance is consistent with pervasive epistasis. In this Review, I discuss experimental designs to detect the contribution of epistasis to quantitative trait phenotypes in model organisms. These studies indicate that epistasis is common, and that additivity can be an emergent property of underlying genetic interaction networks. Epistasis causes hidden quantitative genetic variation in natural populations and could be responsible for the small additive effects, missing heritability and the lack of replication that are typically observed for human complex traits.


Figures

Fig. 1
Fig. 1. Two-locus genotypic effects
(a) Genotypic values for loci X and Y, each with two alleles (X1, X2, Y1, Y2). The additive effect (a) of each locus is one half the difference in mean phenotype between the two homozygous genotypes. The dominance effect (d) is the difference between the mean phenotype of heterozygous individuals and the average phenotype of the homozygous genotypes. d = 0 indicates additive gene action; d ≠ 0 denotes departures from additivity due to dominance. (b) Genotypic values for two-locus genotypes. The first two terms for each genotype denote the additive combination of single locus additive and dominance effects. With epistasis additional terms reflecting additive by additive (aaXY), additive by dominance (adXY, daXY) and dominance by dominance (ddXY) epistasis contribute to the genotype value. (c-d) Graphical representations of genotypic effects at two biallelic loci. (c) Additive gene action at locus X, partial dominance at locus Y, and no epistasis between X and Y. (d) Epistasis where the additive effect of locus Y is much greater in the X1X1 than the X2X2 genetic background. (e) Epistasis where the additive effects of locus X are opposite in the Y1Y1 and Y2Y2 genetic backgrounds.
Fig. 2
Fig. 2. Quantitative genetics of additive by additive interactions
The four double homozygote genotypes at two hypothetical bi-allelic loci (X and Y) are depicted. (a) Genotypic values for an epistatic model (Model 1) in which the effect of the X locus is greater in the Y1Y1 genetic background (blue line) than the Y2Y2 genetic background (red line). (b) Genotypic values for an epistatic model (Model 2) in which the effect of the X locus is of similar magnitude but in the opposite direction in the Y1Y1 genetic background (blue line) than the Y2Y2 genetic background (red line). (c, d) The additive effect of the X locus depends on the frequency at the Y locus for epistatic Models 1 and 2, respectively. (e, f) Additive genetic variance (VA); (g, h) Additive by additive genetic variance (VAA); and (i, j) the ratio of additive genetic variance to the total genetic variance (VA/(VA + VAA)) for epistatic Models 1 and 2, respectively.
Fig. 3
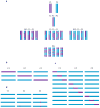
Fig. 3. Genotypes for mapping QTLs between two genetically divergent lines
(a) Parental lines (P1 and P2) are crossed to produce an F1 generation. Common segregating generations used for QTL mapping are backcrosses of the F1 to either parental line (BC1, BC2), F2 derived from mating F1 individuals, and recombinant inbred lines (RILs) derived by inbreeding F2 families. (b-d) Experimental designs based on introgression. (b) Chromosome substitution lines, (c) introgression lines, (d) near-isogenic lines. Three chromosomes (C1 – C3) are depicted.
Fig. 4
Fig. 4. Two dimensional search for epistatic interactions
Data from an experiment mapping QTLs affecting Drosophila lifespan in an RIL population are depicted. The x-axis and y-axis depict the marker loci. Two main effect QTLs are indicated at cytological positions 46C-49D and at 50D (indicated by red shading on the x and y axes). The body of the graph depicts the P-values of the QTL × QTL interaction terms. Main effect QTLs do not interact with each other, but do interact with QTLs without significant main effects. QTLs without significant main effects show significant interaction effects. Red: P < 0.0001; orange: 0.0001 ≤ P < 0.001; yellow: 0.001 ≤ P < 0.01; green: 0.01 ≤ P < 0.05; blue: P ≥ 0.05.
Fig. 5
Fig. 5. Epistasis between naturally occurring variation and mutations in D. melanogaster
(a) Graphical representation of genotypes of i homozygous Drosophila Genetic Reference Panel (DGRP) lines, in which C1, C2 and C3 represent the three major chromosomes. Co-isogenic C2 chromosomes containing a wild type allele (DGRP_i wt) or a mutant allele (red star, DGRP_i M) of a focal gene affecting a quantitative trait have been introgressed into each DGRP line. The quantitative trait is measured for all pairs of wt and M DGRP introgression lines. The difference in phenotype between the wild type and mutant allele in the background on which the mutant was generated is 2a. If there are only additive effects on the phenotype, the expectation is that the effect of the mutation will be the same in each DGRP line background and the expected phenotype of the ith DGRP line with the mutant C2 allele is DGRP_i wt + 2a. If not, the difference between the expected and observed phenotypes is due to epistasis. (b) Estimates of epistatic interactions for ten mutations affecting startle response in 20 DGRP backgrounds. The interaction effects vary among mutations and DGRP lines, and are large and predominantly positive; i.e., naturally occurring variation suppresses the effects of the mutations. (Data from Ref. 79)

References

    1. Kauffman SA. The Origins of Order. Oxford University Press; New York: 1993.
    1. Phillips PC. Epistasis - the essential role of gene interactions in the structure and evolution of genetic systems. Nat Rev Genet. 2008;9:855–867. A comprehensive review describing the importance of studying gene interactions with respect to dissecting regulatory pathways, mapping the genetic basis of complex traits and understanding the structure and evolution of complex systems. - PMC - PubMed
    1. Waddington CH. Canalization of development and the inheritance of acquired characters. Nature. 1942;150:563–565. - PubMed
    1. Waddington CH. The Strategy of Genes. George Allen and Unwin; London: 1957.
    1. Dobzhansky T. Genetics and the Origin of Species. Columbia University Press; New York: 1937.

Publication types

LinkOut - more resources