Review
. 2014 Jan;15(1):34-48.
doi: 10.1038/nrg3575. Epub 2013 Dec 3.

Systems genetics approaches to understand complex traits

Affiliations
Review

Systems genetics approaches to understand complex traits

Mete Civelek et al. Nat Rev Genet. 2014 Jan.

Abstract

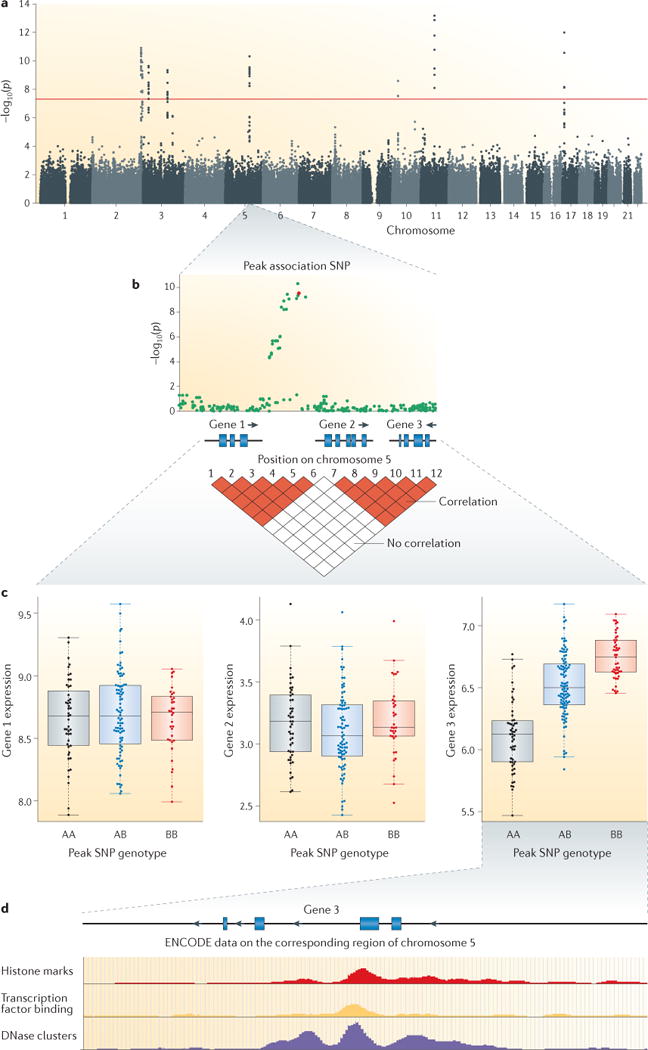
Systems genetics is an approach to understand the flow of biological information that underlies complex traits. It uses a range of experimental and statistical methods to quantitate and integrate intermediate phenotypes, such as transcript, protein or metabolite levels, in populations that vary for traits of interest. Systems genetics studies have provided the first global view of the molecular architecture of complex traits and are useful for the identification of genes, pathways and networks that underlie common human diseases. Given the urgent need to understand how the thousands of loci that have been identified in genome-wide association studies contribute to disease susceptibility, systems genetics is likely to become an increasingly important approach to understanding both biology and disease.


Conflict of interest statement

Competing interests statement

The authors declare no competing interests.

Figures

None
APH1B, APH1B γ-secretase subunit; ARSD, arylsulfatase D; BMI, body mass index; C8orf82, chromosome 8 open reading frame 82; GLU, glucose levels; GNB1, guanine nucleotide-binding protein, β-polypeptide1; HOMA, index of insulin sensitivity; INS, insulin levels; LDL, low-density lipoprotein levels; MYL5, myosin, light chain 5, regulatory; NINJ2, ninjurin2; PRMT2, protein arginine methyltransferase 2; SLC7A10, solute carrier family 7 member 10; TG, triglyceride levels; TPMT, thiopurine S-methyltransferase; WHR, waist:hip ratio. The figure is modified, with permission, from REF. © (2011) Macmillan Publishers Ltd. All rights reserved.
Figure 1
Figure 1. Systems genetics strategies
The left panel shows various designs of systems genetics studies. Aa | In the simplest scenario, an intermediate phenotype, such as transcript levels, is quantitated in a population and integrated with a clinical trait on the basis of correlation and mapping. Ab | In the second scenario, multiple intermediate phenotypes are studied, which allows interactions across biological scales to be examined. Ac | In the third scenario, data across multiple scales are used to model a biological network. B | Interactions (shown as arrows) of molecular phenotypes across multiple biological scales — including genes (G), transcripts (T), proteins (P), metabolites (M) and microbiome — can be used to create a map on the basis of natural variation. C | Based on correlations of the traits that occur across individuals in a population, one can model a biological network. For example, based on natural variations of genes 1–4 (G1–4), a directional expression network can be modelled. Part A is modified, with permission, from REF. © (2009) Macmillan Publishers Ltd. All rights reserved.
Figure 2
Figure 2. Collection and analysis of systems genetics data
An overview of the steps of a systems genetics study is shown. a | A population of individuals who differ in traits of interest is identified. The population could be either a group of unrelated individuals or a segregating population (that is, a family). These individuals are then examined for clinical traits of interest, and one or more intermediate phenotypes from tissues of interest are quantified using high-throughput technologies. Each intermediate phenotype is shown by different shades of the same colour in the graphs. b | The relationships between these traits can be analysed by examining pairwise correlations. A correlation could result from causal, reactive or independent relationships. c | Loci that contribute to these traits can be mapped either by association or by linkage. In this example, single-nucleotide polymorphisms (SNPs) that are genotyped using a high-density genotyping microarray are tested for association with the traits using linear regression. The negative logarithm of the p-values for each SNP are plotted against the position of the SNP across the genome. Coincident mapping of multiple traits (the peak on the left) indicates the possibility of a causal relationship. The red dashed line represents the p-value threshold. d | Higher-order interactions among molecular phenotypes can be modelled using both statistical and network-based approaches. This example shows part of a genetic interaction network, in which highly correlated transcripts are clustered to form modules of co-regulated genes. Relationships among genes can be either directional (arrows) or non-directional (lines). Here, genes are grouped into modules that are denoted by different colours, and the outlined circles represent the hub genes, which have the most connections in their respective modules. e | The relationship between such modules and clinical traits can then be examined by correlating either the average gene expression levels or principal components in a module with the trait.
Figure 3
Figure 3. Genetics of gene expression and genetic interactions
Common genetic variations that affect transcript levels can be examined globally using either gene expression arrays or high-throughput RNA sequencing (RNA-seq). a | Cis and trans effects of gene expression are shown. Genomic loci that regulate the expression of a gene in the same locus are termed cis-expression quantitative trait loci (cis-eQTLs), whereas loci that regulate the expression of genes that are distant (which are often on another chromosome) are termed trans-eQTLs. b | A global view of the genetic architecture of gene expression is shown. The x and y axes show the genomic location of the single-nucleotide polymorphism (SNP) variants and the transcripts, respectively. Each dot shows a significant association. In this example, dots along the diagonal represent cis-eQTLs, and the rest show trans-eQTLs. There are also several hot spots that regulate hundreds of genes in trans, which are shown by dots along the vertical lines. c | Gene-by-gene interaction in oesophageal squamous cell carcinoma is shown. The effect size of each allele (A and G) of the ADH1B (alcohol dehydrogenase 1B (class I), β-polypeptide) and the ALDH2 (aldehyde dehydrogenase 2 family (mitochondrial)) genes, as indicated by the odds ratio for the incidence of oesophageal cancer, is not additive and is also influenced by alcohol consumption. d | In one example of a gene-by-environment interaction, the expression of a gene is examined in macrophages from 100 strains of mice that are cultured in either the presence or the absence of bacterial endotoxin. Mice with certain genetic backgrounds do not respond to the treatment (some examples of which are circled), whereas others respond to the treatment to different degrees (some examples of which are indicated by arrows). Part a is modified, with permission, from REF. © (2011) Macmillan Publishers Ltd. All rights reserved. Part b is modified, with permission, from REF. © (2012) Elsevier Science. Part c is modified, with permission, from REF. © (2012) Macmillan Publishers Ltd. All rights reserved.
Figure 4
Figure 4. Predicting causal genes in GWAS loci
In this hypothetical example, the association of a clinical trait with multiple genomic loci is discovered through a genome-wide association study (GWAS; part a). The red line represents the p-value threshold. In order to understand the causal gene (or genes) in the chromosome 5 region, a detailed regional association plot is generated. Although the peak single-nucleotide polymorphism (SNP; shown in red) is in a linkage disequilibrium (LD) block with Gene 1, the neighbouring LD block contains Genes 2 and 3 in close proximity. The matrix below the association plot shows loci that are co-inherited without recombination (red diamonds) and hence form an LD block (part b). Expression quantitative trait locus (eQTL) mapping of transcript abundance of the three genes in various tissues can help to predict the causal gene. In this example, Gene 3 has a significant association with the peak GWAS SNP and is therefore the probable causal candidate gene in this locus. Note that it resides in a different LD block from where the peak SNP is located (part c). Overlaying the Encyclopedia of DNA Elements (ENCODE) data available for the genomic region that contains Gene 3 helps to generate specific hypotheses for the mechanism of how the GWAS SNP, or the SNPs that are in high LD based on the 1,000 Genomes data, regulates the expression of this gene (part d).

References

    1. Musunuru K, et al. From noncoding variant to phenotype via SORT1 at the 1p13 cholesterol locus. Nature. 2010;466:714–719. - PMC - PubMed
    1. Ayroles JF, et al. Systems genetics of complex traits in Drosophila melanogaster. Nature Genet. 2009;41:299–307. - PMC - PubMed
    1. Falconer DS, Mackay TFC. Introduction to Quantitative Genetics. 4. Longman; 1996.
    1. Huang W, et al. Epistasis dominates the genetic architecture of Drosophila quantitative traits. Proc Natl Acad Sci USA. 2012;109:15553–15559. - PMC - PubMed
    1. Lynch M, Walsh JB. Genetics and Analysis of Quantitative Traits. Sinauer Associates; 1998.

Publication types