Costimulation modulation with abatacept in patients with recent-onset type 1 diabetes: follow-up 1 year after cessation of treatment
- PMID: 24296850
- PMCID: PMC3964491
- DOI: 10.2337/dc13-0604
Costimulation modulation with abatacept in patients with recent-onset type 1 diabetes: follow-up 1 year after cessation of treatment
Abstract
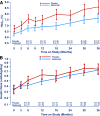
OBJECTIVE We previously reported that 2 years of costimulation modulation with abatacept slowed decline of β-cell function in recent-onset type 1 diabetes (T1D). Subsequently, abatacept was discontinued and subjects were followed to determine whether there was persistence of effect. RESEARCH DESIGN AND METHODS Of 112 subjects (ages 6-36 years) with T1D, 77 received abatacept and 35 received placebo infusions intravenously for 27 infusions over 2 years. The primary outcome-baseline-adjusted geometric mean 2-h area under the curve (AUC) serum C-peptide during a mixed-meal tolerance test (MMTT) at 2 years-showed higher C-peptide with abatacept versus placebo. Subjects were followed an additional year, off treatment, with MMTTs performed at 30 and 36 months. RESULTS C-peptide AUC means, adjusted for age and baseline C-peptide, at 36 months were 0.217 nmol/L (95% CI 0.168-0.268) and 0.141 nmol/L (95% CI 0.071-0.215) for abatacept and placebo groups, respectively (P = 0.046). The C-peptide decline from baseline remained parallel with an estimated 9.5 months' delay with abatacept. Moreover, HbA1c levels remained lower in the abatacept group than in the placebo group. The slightly lower (nonsignificant) mean total insulin dose among the abatacept group reported at 2 years was the same as the placebo group by 3 years. CONCLUSIONS Costimulation modulation with abatacept slowed decline of β-cell function and improved HbA1c in recent-onset T1D. The beneficial effect was sustained for at least 1 year after cessation of abatacept infusions or 3 years from T1D diagnosis.
Figures


References
-
- The Diabetes Control and Complications Trial Research Group Effect of intensive therapy on residual beta-cell function in patients with type 1 diabetes in the diabetes control and complications trial. A randomized, controlled trial. Ann Intern Med 1998;128:517–523 - PubMed
-
- Steffes MW, Sibley S, Jackson M, Thomas W. Beta-cell function and the development of diabetes-related complications in the diabetes control and complications trial. Diabetes Care 2003;26:832–836 - PubMed
Publication types
MeSH terms
Substances
Grants and funding
- UL1 RR024139/RR/NCRR NIH HHS/United States
- U01-DK-084565/DK/NIDDK NIH HHS/United States
- UL1-RR-024139/RR/NCRR NIH HHS/United States
- UL1-RR-024153/RR/NCRR NIH HHS/United States
- U01-DK-061042/DK/NIDDK NIH HHS/United States
- U01 DK061036/DK/NIDDK NIH HHS/United States
- UL1 RR024982/RR/NCRR NIH HHS/United States
- UL1 RR025744/RR/NCRR NIH HHS/United States
- U01 DK061042/DK/NIDDK NIH HHS/United States
- U01 DK061041/DK/NIDDK NIH HHS/United States
- U01 DK085476/DK/NIDDK NIH HHS/United States
- UL1-RR-024975/RR/NCRR NIH HHS/United States
- M01 RR000400/RR/NCRR NIH HHS/United States
- UL1 TR000005/TR/NCATS NIH HHS/United States
- U01 DK061010/DK/NIDDK NIH HHS/United States
- UL1 RR025761/RR/NCRR NIH HHS/United States
- P30 DK063720/DK/NIDDK NIH HHS/United States
- U01 DK061040/DK/NIDDK NIH HHS/United States
- UL1 RR024153/RR/NCRR NIH HHS/United States
- UL1 RR029890/RR/NCRR NIH HHS/United States
- UL1 TR001105/TR/NCATS NIH HHS/United States
- UL1 RR031986/RR/NCRR NIH HHS/United States
- U01 DK085466/DK/NIDDK NIH HHS/United States
- U01-DK-085509/DK/NIDDK NIH HHS/United States
- U01 DK061058/DK/NIDDK NIH HHS/United States
- U01 DK085505/DK/NIDDK NIH HHS/United States
- U01 DK085453/DK/NIDDK NIH HHS/United States
- UL1 RR025780/RR/NCRR NIH HHS/United States
- U01-DK-061036/DK/NIDDK NIH HHS/United States
- U01-DK-061041/DK/NIDDK NIH HHS/United States
- U01-DK-085463/DK/NIDDK NIH HHS/United States
- U01-DK-085466/DK/NIDDK NIH HHS/United States
- MR/J006742/1/MRC_/Medical Research Council/United Kingdom
- UL1-RR-031986/RR/NCRR NIH HHS/United States
- UL1 RR024131/RR/NCRR NIH HHS/United States
- DP3 DK097681/DK/NIDDK NIH HHS/United States
- U01 DK085499/DK/NIDDK NIH HHS/United States
- UL1 TR000093/TR/NCATS NIH HHS/United States
- U01 DK085463/DK/NIDDK NIH HHS/United States
- UL1 TR001108/TR/NCATS NIH HHS/United States
- U01-DK-085505/DK/NIDDK NIH HHS/United States
- U01 DK061055/DK/NIDDK NIH HHS/United States
- U01-DK-061055/DK/NIDDK NIH HHS/United States
- UL1 TR001085/TR/NCATS NIH HHS/United States
- UL1-RR-025744/RR/NCRR NIH HHS/United States
- U01 DK061034/DK/NIDDK NIH HHS/United States
- UL1-RR-025780/RR/NCRR NIH HHS/United States
- UL1-RR-024982/RR/NCRR NIH HHS/United States
- UL1 TR001082/TR/NCATS NIH HHS/United States
- U01 DK085461/DK/NIDDK NIH HHS/United States
- U01-DK-061058/DK/NIDDK NIH HHS/United States
- U01 DK085509/DK/NIDDK NIH HHS/United States
- UL1 RR024975/RR/NCRR NIH HHS/United States
- UL1-RR-025761/RR/NCRR NIH HHS/United States
- UL1-RR-029890/RR/NCRR NIH HHS/United States
- UC4 DK117009/DK/NIDDK NIH HHS/United States
- U01-DK-085461/DK/NIDDK NIH HHS/United States
- UL1 TR000004/TR/NCATS NIH HHS/United States
- U01-DK-061034/DK/NIDDK NIH HHS/United States
- U01-DK-061040/DK/NIDDK NIH HHS/United States
- UL1-RR-024131/RR/NCRR NIH HHS/United States
- U01-DK-061010/DK/NIDDK NIH HHS/United States
- UC4 DK097835/DK/NIDDK NIH HHS/United States
- M01-RR-00400/RR/NCRR NIH HHS/United States
- HHSN267200800019C/LM/NLM NIH HHS/United States
- U01-DK-085453/DK/NIDDK NIH HHS/United States
- U01-DK-061016/DK/NIDDK NIH HHS/United States
- U01-DK-085499/DK/NIDDK NIH HHS/United States
LinkOut - more resources
Full Text Sources
Other Literature Sources
Medical

