The evidence of HeLa cell apoptosis induced with tetraethylammonium using proteomics and various analytical methods
- PMID: 24297172
- PMCID: PMC3900967
- DOI: 10.1074/jbc.M113.515932
The evidence of HeLa cell apoptosis induced with tetraethylammonium using proteomics and various analytical methods
Abstract
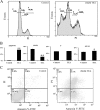
Tetraethylammonium (TEA) is a potassium channel (KCh) blocker applied in the functional and pharmacological studies of the KChs. The MTT (3-(4,5-dimethylthiazol-2-yl)-2,5-diphenyltetrazolium bromide) assay, a colorimetric assay to quantitatively measure living cells, demonstrated that TEA reduced the HeLa cell viability dose-dependently. Flow cytometry analysis indicated an increased apoptosis rate of the HeLa cell after exposing to TEA. The patch clamp technique revealed that the K(+) current of the HeLa cell was inhibited up to 80% when exposed to TEA. In addition, quantitative real-time PCR approach set up cross-talk among the cytotoxicity of TEA, 4-aminopyridine, and anti-cancer drug such as cisplatin. Using comparative proteomics combined with MALDI-TOF MS/MS, 33 significantly changed proteins were found from TEA treatment group; among these proteins, 12 were up-regulated, and 21 were down-regulated. Here we indicated that these proteins were closely connected with many biological functions such as oxidative stress response, signal transduction, metabolism, protein synthesis, and degradation. Both Western blotting and quantitative real-time PCR approaches further verified these differential proteins. Ingenuity Pathways Analysis software, a tool to analyze "omics" data and model biological system, was applied to analyze the interaction pathways of these proteins. The subcellular locations of the differential proteins are also predicted from Uniprot. All results above can help in our understanding of the mechanism of TEA-induced cytotoxicity and provide potential cancer biomarkers. Various experimental results in this study (like those for cisplatin) indicated that TEA is not only a KCh blocker but also a potential anti-cancer drug.
Keywords: Apoptosis; Bioinformatics; Flow Cytometry; HeLa Cell Line; Patch Clamp Technology; Pharmacology; Proteomics; RT-qPCR; Tetraethylammonium; Western Blotting.
Figures


Similar articles
-
Arsenic trioxide-induced hela cell death is partially prevented by K+ channel blockers.Yao Xue Xue Bao. 2005 Jul;40(7):644-8. Yao Xue Xue Bao. 2005. PMID: 16196273
-
Heat shock proteins and p53 play a critical role in K+ channel-mediated tumor cell proliferation and apoptosis.Apoptosis. 2007 Oct;12(10):1837-46. doi: 10.1007/s10495-007-0101-9. Apoptosis. 2007. PMID: 17624594
-
PACAP inhibits delayed rectifier potassium current via a cAMP/PKA transduction pathway: evidence for the involvement of I k in the anti-apoptotic action of PACAP.Eur J Neurosci. 2004 Mar;19(6):1446-58. doi: 10.1111/j.1460-9568.2004.03227.x. Eur J Neurosci. 2004. PMID: 15066141
-
[Effect of potassium channel on the proliferation, apoptosis and related-gene expression in human bronchial smooth muscle cells].Zhonghua Jie He He Hu Xi Za Zhi. 2004 Dec;27(12):841-6. Zhonghua Jie He He Hu Xi Za Zhi. 2004. PMID: 15730786 Chinese.
-
[Inhibitory effects of tetraethylammonium on proliferation and voltage-gated potassium channels in human cervical carcinoma cell line SiHa].Ai Zheng. 2006 Apr;25(4):451-5. Ai Zheng. 2006. PMID: 16613679 Chinese.
Cited by
-
Rational creation and systematic analysis of cervical cancer kinase-inhibitor binding profile.J Comput Aided Mol Des. 2019 Jul;33(7):689-698. doi: 10.1007/s10822-019-00211-1. Epub 2019 Jun 15. J Comput Aided Mol Des. 2019. PMID: 31203490
-
Identification of a Novel ERK5 (MAPK7) Inhibitor, MHJ-627, and Verification of Its Potent Anticancer Efficacy in Cervical Cancer HeLa Cells.Curr Issues Mol Biol. 2023 Jul 24;45(7):6154-6169. doi: 10.3390/cimb45070388. Curr Issues Mol Biol. 2023. PMID: 37504304 Free PMC article.
-
The Synergistic Effect of Combination Progesterone and Temozolomide on Human Glioblastoma Cells.PLoS One. 2015 Jun 25;10(6):e0131441. doi: 10.1371/journal.pone.0131441. eCollection 2015. PLoS One. 2015. PMID: 26110872 Free PMC article.
-
Role of Calcium-Activated Potassium Channels in Proliferation, Migration and Invasion of Human Chronic Myeloid Leukemia K562 Cells.Membranes (Basel). 2023 Jun 4;13(6):583. doi: 10.3390/membranes13060583. Membranes (Basel). 2023. PMID: 37367787 Free PMC article.
-
Ion channel expression in the developing enteric nervous system.PLoS One. 2015 Mar 23;10(3):e0123436. doi: 10.1371/journal.pone.0123436. eCollection 2015. PLoS One. 2015. PMID: 25798587 Free PMC article.
References
-
- Saraste A., Pulkki K., Kallajoki M., Henriksen K., Parvinen M., Voipio-Pulkki L.-M. (1997) Apoptosis in human acute myocardial infarction. Circulation 95, 320–323 - PubMed
-
- Lowe S. W., Lin A. W. (2000) Apoptosis in cancer. Carcinogenesis 21, 485–495 - PubMed
-
- Hanayama R., Tanaka M., Miyasaka K., Aozasa K., Koike M., Uchiyama Y., Nagata S. (2004) Autoimmune disease and impaired uptake of apoptotic cells in MFG-E8-deficient mice. Science 304, 1147–1150 - PubMed
Publication types
MeSH terms
Substances
LinkOut - more resources
Full Text Sources
Other Literature Sources
Medical

