. 2014 Jan 17;289(3):1519-28.
doi: 10.1074/jbc.M113.511295. Epub 2013 Dec 2.

Mitochondria contribute to NADPH generation in mouse rod photoreceptors

Affiliations

Mitochondria contribute to NADPH generation in mouse rod photoreceptors

Leopold Adler 4th et al. J Biol Chem. .

Abstract

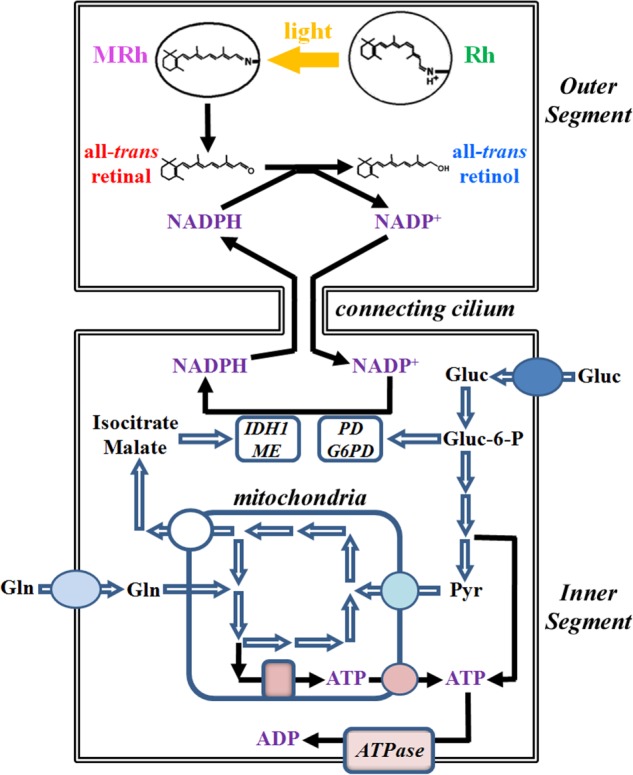
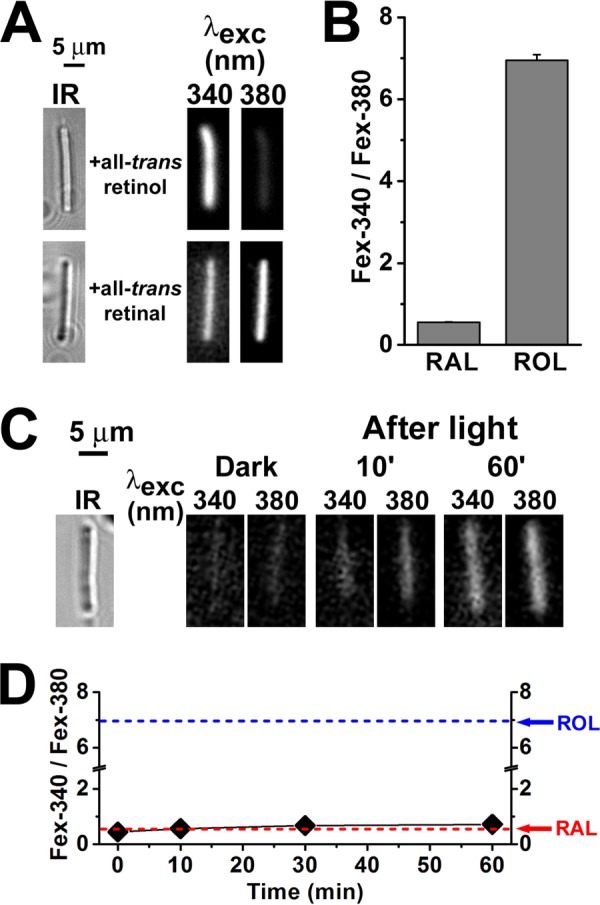
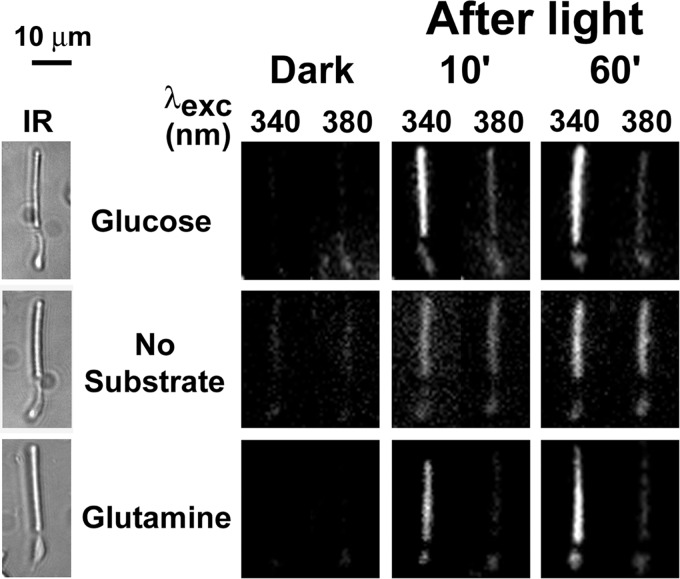
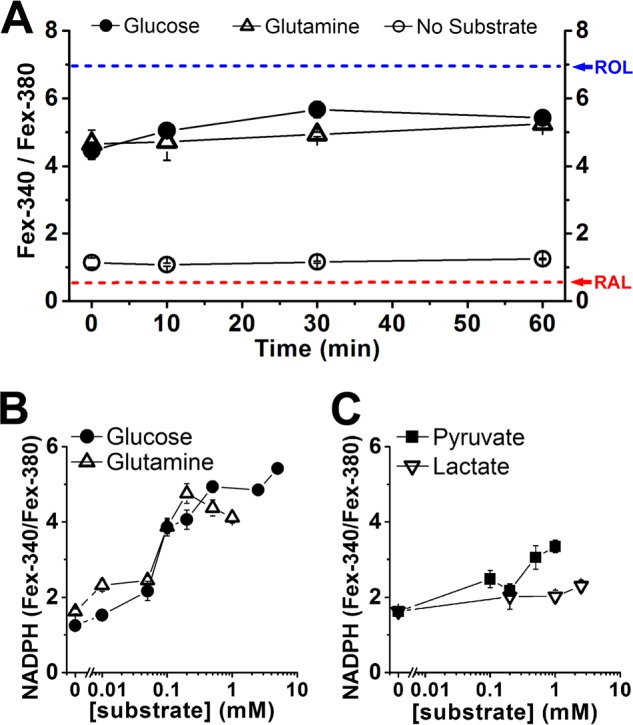
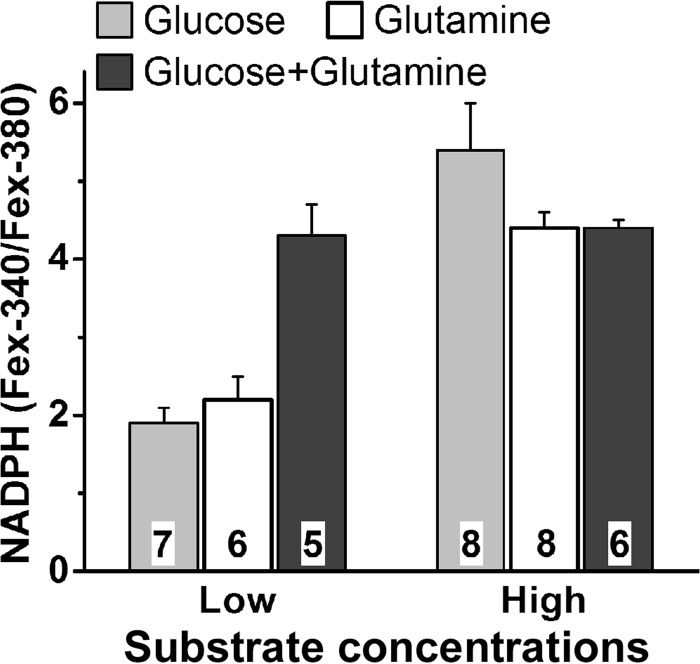
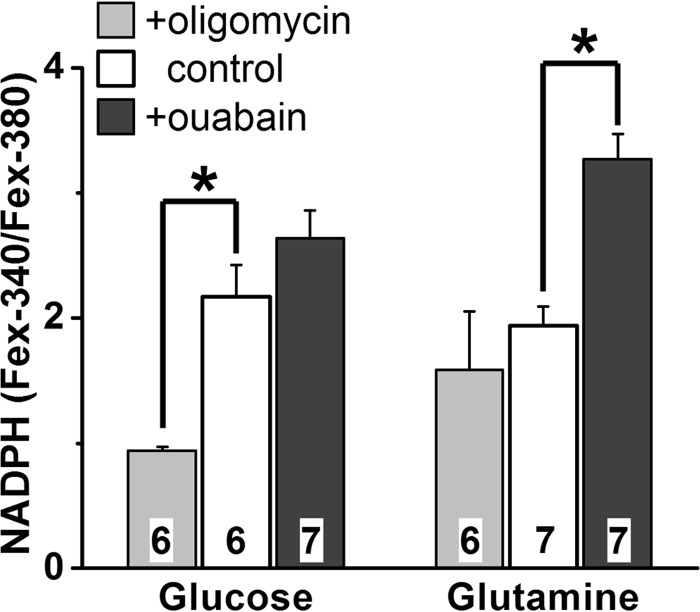
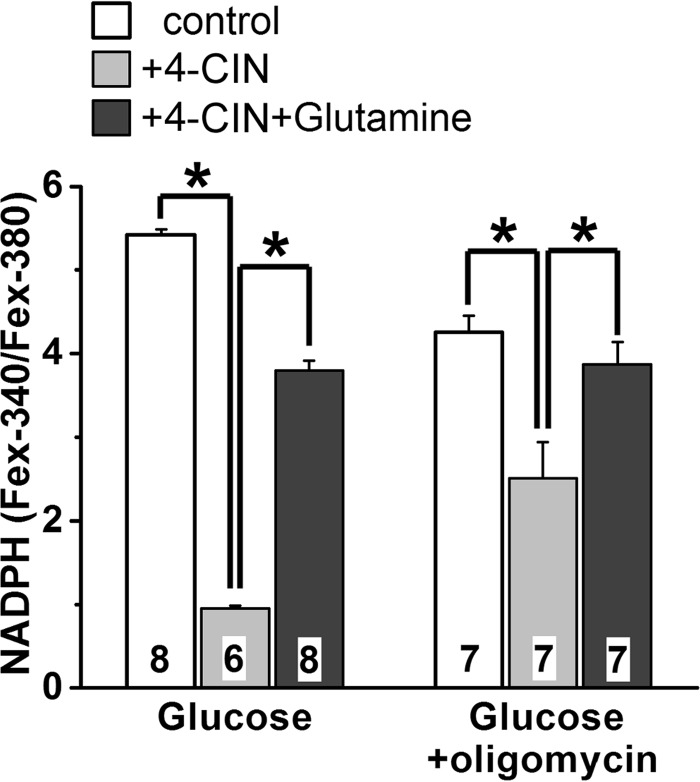
NADPH is the primary source of reducing equivalents in the cytosol. Its major source is considered to be the pentose phosphate pathway, but cytosolic NADP(+)-dependent dehydrogenases using intermediates of mitochondrial pathways for substrates have been known to contribute. Photoreceptors, a nonproliferating cell type, provide a unique model for measuring the functional utilization of NADPH at the single cell level. In these cells, NADPH availability can be monitored from the reduction of the all-trans-retinal generated by light to all-trans-retinol using single cell fluorescence imaging. We have used mouse rod photoreceptors to investigate the generation of NADPH by different metabolic pathways. In the absence of extracellular metabolic substrates, NADPH generation was severely compromised. Extracellular glutamine supported NADPH generation to levels comparable to those of glucose, but pyruvate and lactate were relatively ineffective. At low extracellular substrate concentrations, partial inhibition of ATP synthesis lowered, whereas suppression of ATP consumption augmented NADPH availability. Blocking pyruvate transport into mitochondria decreased NADPH availability, and addition of glutamine restored it. Our findings demonstrate that in a nonproliferating cell type, mitochondria-linked pathways can generate substantial amounts of NADPH and do so even when the pentose phosphate pathway is operational. Competing demands for ATP and NADPH at low metabolic substrate concentrations indicate a vulnerability to nutrient shortages. By supporting substantial NADPH generation, mitochondria provide alternative metabolic pathways that may support cell function and maintain viability under transient nutrient shortages. Such pathways may play an important role in protecting against retinal degeneration.

Keywords: Fluorescence; Metabolism; Mitochondria; NADPH; Photoreceptors; Retinoid.


Figures

FIGURE 1.
FIGURE 1.
Scheme for the generation of NADPH by rod inner segment metabolic pathways utilizing glucose and glutamine as substrates. The generated NADPH is a necessary cofactor for the reduction of retinal to retinol in the rod outer segment. The metabolic substrate for the pentose phosphate pathway is glucose, which can enter the pathway after its phosphorylation to glucose-6-phosphate (Gluc-6-P) by a hexokinase. Through the pentose phosphate pathway, one molecule of glucose generates two molecules of NADPH: one is generated through the oxidation of glucose-6-phosphate to 6-phosphogluconolactone by glucose-6-phosphate dehydrogenase (G6PD), and one more is generated through the oxidative decarboxylation of 6-phosphogluconate to ribulose-5-phosphate by 6-phosphogluconate dehydrogenase (PD). NADPH can also be generated by cytosolic NADP+-dependent isocitrate dehydrogenase 1 (IDH1) and malic enzyme (ME), which catalyze the oxidative decarboxylation of isocitrate to α-ketoglutarate and the oxidation of malate to pyruvate, respectively. Isocitrate and malate originate from the mitochondria where they also participate in the TCA cycle. Rh, rhodopsin; MRh, metarhodopsin; Gluc, glucose; Gln, glutamine; Pyr, pyruvate.
FIGURE 2.
FIGURE 2.
Measurement of RAL and ROL Fex-340/Fex-380 fluorescence ratios. Fluorescence was excited with 340- and 380-nm light, and emission was collected for >420 nm. A, fluorescence of mouse broken off rod outer segments (rod outer segments separated from the rest of the cell) loaded with 50 μm all-trans-retinol or all-trans-retinal (for 5 min, using 1% BSA as carrier). IR, infrared images of the outer segments. Fluorescence images of the outer segments after loading with retinoid are shown with the same intensity scaling to facilitate comparisons. B, values of the Fex-340/Fex-380 fluorescence intensity ratio for retinal and retinol, obtained by loading broken off rod outer segments with 50 μm RAL (n = 6 cells) and 50 μm ROL (n = 8 cells). C, mouse broken off rod outer segments cannot support the reduction of all-trans-retinal to retinol. IR, infrared image of an outer segment; fluorescence images of the outer segment before (Dark) and at different times after bleaching are shown with the same intensity scaling to facilitate comparisons; glucose concentration was 5 mm. D, dependence of the Fex-340/Fex-380 fluorescence intensity ratio on time after bleaching in broken off rod outer segments (♦, n = 6), in the absence of any exogenously added retinoid. The arrows point to the values of the ratio for RAL and ROL as determined in B. The value of the fluorescence ratio for the endogenous retinoid that appears after bleaching is similar to that for all-trans-retinal. All experiments were performed at 37 °C.
FIGURE 3.
FIGURE 3.
Determination of outer segment pH in isolated mouse rod photoreceptors with BCECF, a ratiometric pH-sensitive dye. BCECF fluorescence was excited with 495- and 440-nm light, and emission was measured >515 nm. A, calibration curve for BCECF (1 mm) in phosphate-buffered physiological saline; three determinations at each pH. The standard error bars that do not appear in the graph were smaller than symbol size. The straight line is a least squares fit to the data points, giving pH = 5.86 + 0.15 × F495/F440. This equation was used to convert the F495/F440 fluorescence ratio to pH. B, infrared (IR) bright field and fluorescence (495-nm excitation) images of an isolated mouse rod photoreceptor loaded with BCECF. C, outer segment pH of isolated mouse rod photoreceptors before (Dark) and at different times after bleaching. The numbers of cells are shown within each column; the cells for Dark and at 0 and 10 min after bleaching were the same (a cell was selected, bleached and fluorescence was measured until 10 min after bleaching); different cells were used for the measurement 60 min after bleaching. All experiments, including calibrations, were performed at 37 °C.
FIGURE 4.
FIGURE 4.
Dependence of the fraction Nred = [NADPH]/([NADPH] + [NADP+]) on the fluorescence ratio Fex-340/Fex-380. The dependence has been calculated from Equation 6 for the two different values, 5.1 and 15.7, of the ratio QYR of the quantum yield of retinol over that of retinal. Fex-340 and Fex-380 are the fluorescence intensities excited by 340- and 380-nm light, respectively (emission, >420 nm).
FIGURE 5.
FIGURE 5.
Glutamine can support retinol formation in isolated mouse rod photoreceptors. Retinol and retinal were distinguished by exciting fluorescence with 340- and 380-nm light and collecting emission for >420 nm. IR, infrared images of the cells; fluorescence images of the cells before (Dark) and at different times after bleaching are shown with the same intensity scaling to facilitate comparisons. Glucose concentration was 5 mm; glutamine concentration was 0.2 mm. Experiments were performed at 37 °C.
FIGURE 6.
FIGURE 6.
Measurement of NADPH availability from the ratio Fex-340/Fex-380 of the fluorescence intensities excited by 340- and 380-nm light. Fluorescence emission was collected >420 nm. A, dependence of the Fex-340/Fex-380 fluorescence intensity ratio on time after bleaching in the presence of 5 mm glucose (●, n = 8 cells), 0.2 mm glutamine (▵, n = 7 cells), and without any substrate (○, n = 9 cells). The value of the ratio at 60 min after bleaching was used as a measure of NADPH availability. The arrows point to the values of the ratio for RAL and ROL (Fig. 2B). B, glucose (●) and glutamine (▵) support NADPH generation in a concentration-dependent manner; n ≥ 6 cells used at each substrate concentration. C, pyruvate (■) and lactate (▿) support NADPH generation; n ≥ 6 cells used at each substrate concentration. The error bars represent standard errors. Experiments were performed at 37 °C.
FIGURE 7.
FIGURE 7.
Additive effect of glucose and glutamine on NADPH availability at low but not at high concentrations. NADPH availability was measured from the Fex-340/Fex-380 ratio of rod outer segment fluorescence (emission, >420 nm), 60 min after bleaching. Low concentrations were 50 μm glucose and 50 μm glutamine; high concentrations were 5 mm glucose and 0.5 mm glutamine. Cell numbers are shown within each column. The error bars represent standard errors. Experiments were performed at 37 °C.
FIGURE 8.
FIGURE 8.
Oligomycin suppresses and ouabain enhances NADPH generation. NADPH generation was measured from its availability as the Fex-340/Fex-380 ratio of rod outer segment fluorescence (emission, >420 nm), 60 min after bleaching. Metabolic substrate (glucose or glutamine) concentration was 50 μm. Oligomycin and ouabain concentrations were 5 μm and 0.1 mm, respectively. Cell numbers are shown within each column. Error bars represent standard errors. Experiments were performed at 37 °C.
FIGURE 9.
FIGURE 9.
Glutamine reverses the suppression of NADPH generation by 4-CIN. NADPH generation was measured from its availability as the Fex-340/Fex-380 ratio of rod outer segment fluorescence (emission, >420 nm), 60 min after bleaching. Glucose and glutamine concentrations were 5.0 and 0.5 mm, respectively. Oligomycin and 4-CIN concentrations were 5 μm and 1.0 mm, respectively. Cell numbers are shown within each column. Error bars represent standard errors. Experiments were performed at 37 °C.

References

    1. Stanton R. C. (2012) Glucose-6-phosphate dehydrogenase, NADPH, and cell survival. IUBMB Life 64, 362–369 - PMC - PubMed
    1. Nelson D. L., Cox M. M. (2000) Lehninger Principles of Biochemistry, pp. 558–562, Worth, New York
    1. Lunt S. Y., Vander Heiden M. G. (2011) Aerobic glycolysis. Meeting the metabolic requirements of cell proliferation. Annu. Rev. Cell Dev. Biol. 27, 441–464 - PubMed
    1. Vander Heiden M. G., Cantley L. C., Thompson C. B. (2009) Understanding the Warburg effect. The metabolic requirements of cell proliferation. Science 324, 1029–1033 - PMC - PubMed
    1. DeBerardinis R. J., Mancuso A., Daikhin E., Nissim I., Yudkoff M., Wehrli S., Thompson C. B. (2007) Beyond aerobic glycolysis. Transformed cells can engage in glutamine metabolism that exceeds the requirement for protein and nucleotide synthesis. Proc. Natl. Acad. Sci. U.S.A. 104, 19345–19350 - PMC - PubMed

Publication types

MeSH terms

LinkOut - more resources