

Molecular and thermodynamic mechanisms of the chloride-dependent human angiotensin-I-converting enzyme (ACE)
- PMID: 24297181
- PMCID: PMC3894356
- DOI: 10.1074/jbc.M113.512335
Molecular and thermodynamic mechanisms of the chloride-dependent human angiotensin-I-converting enzyme (ACE)
Abstract
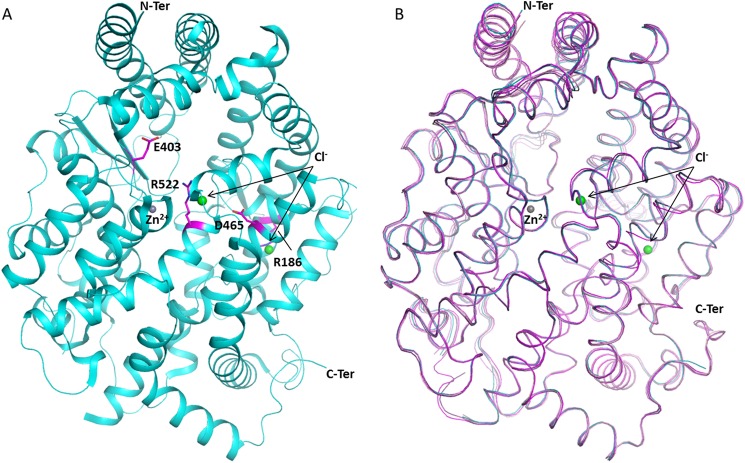
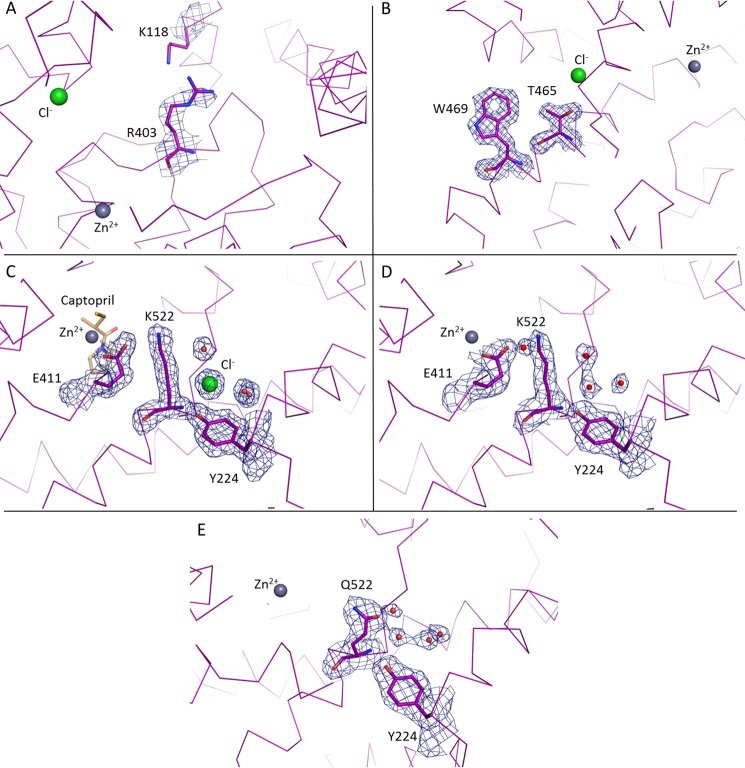
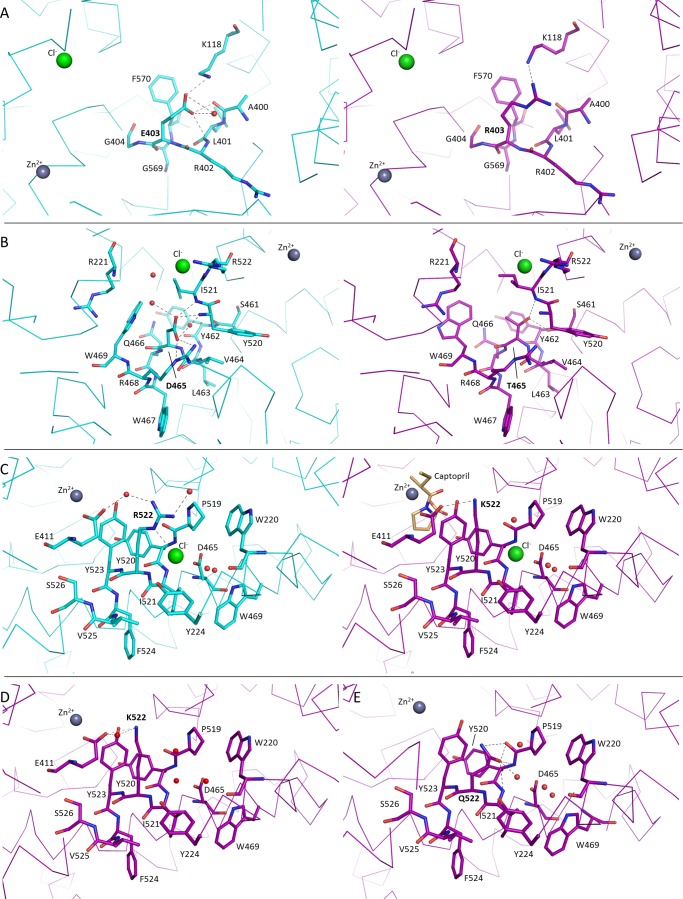
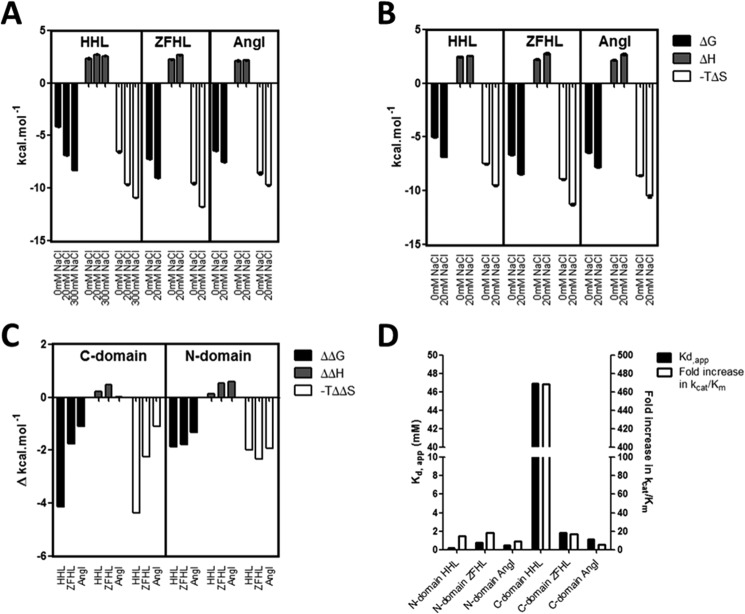
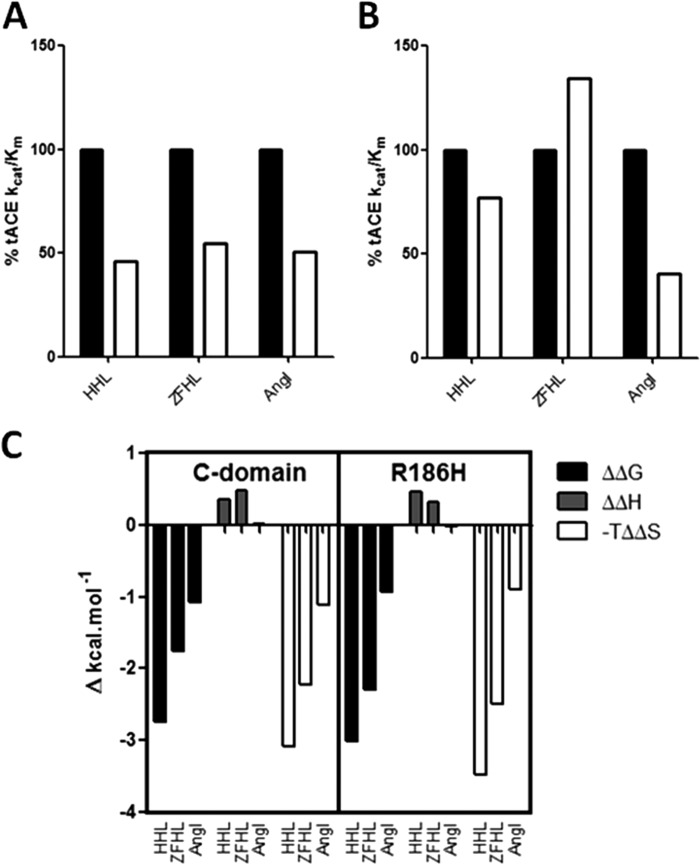
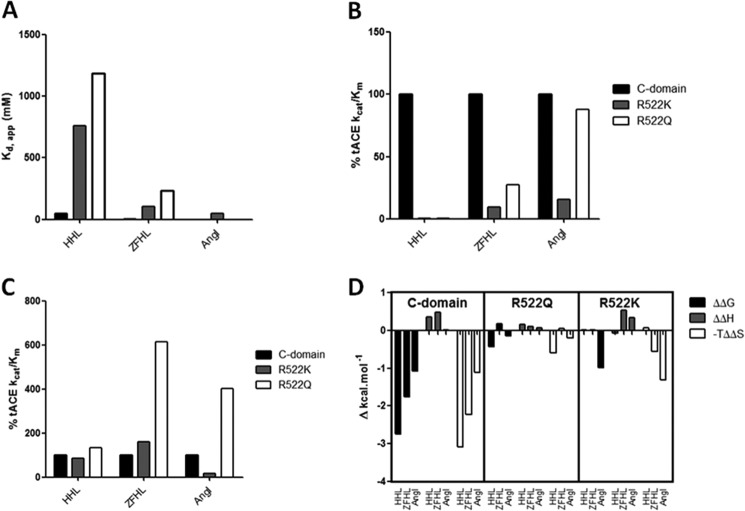
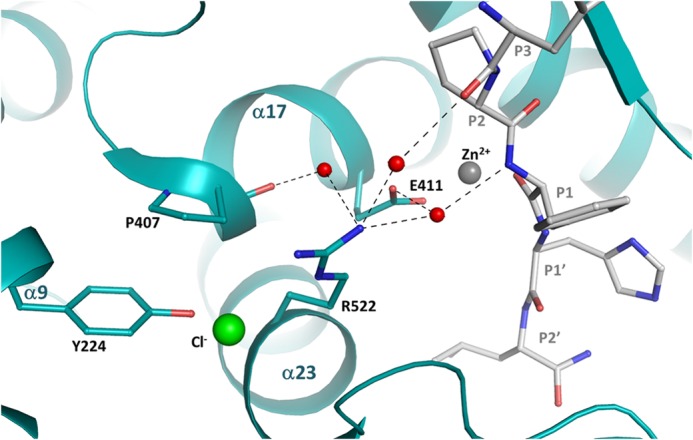
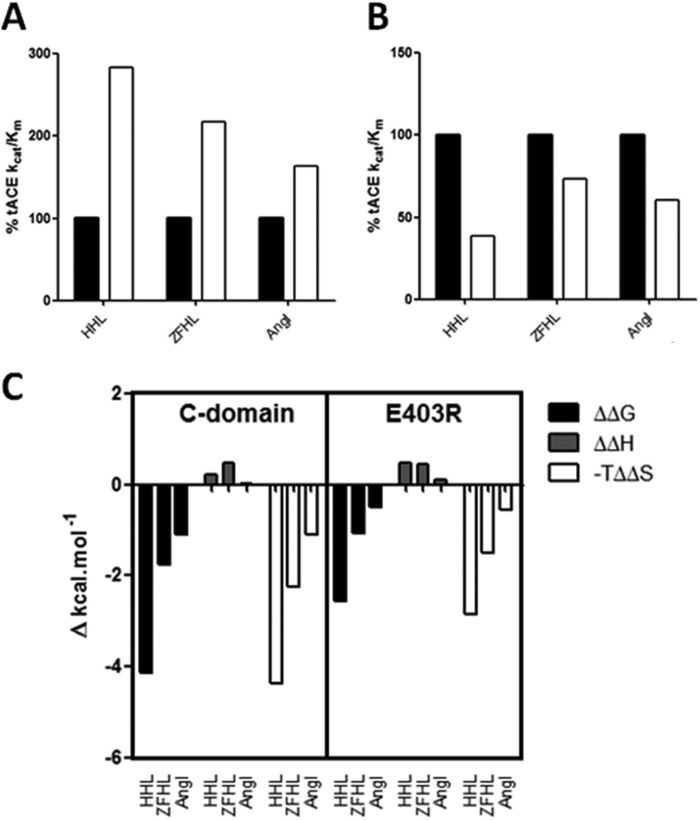
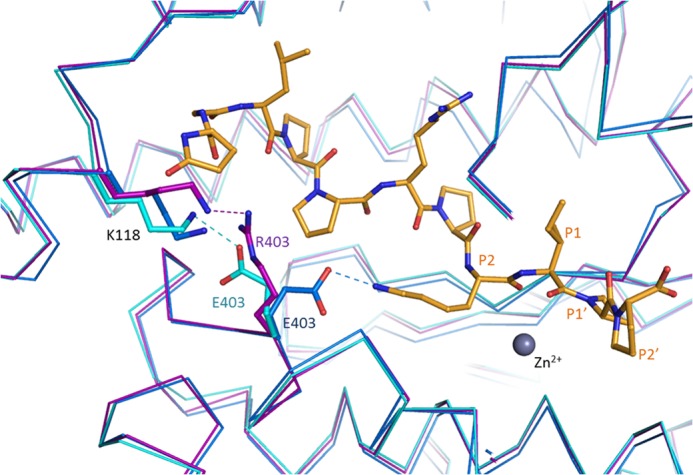
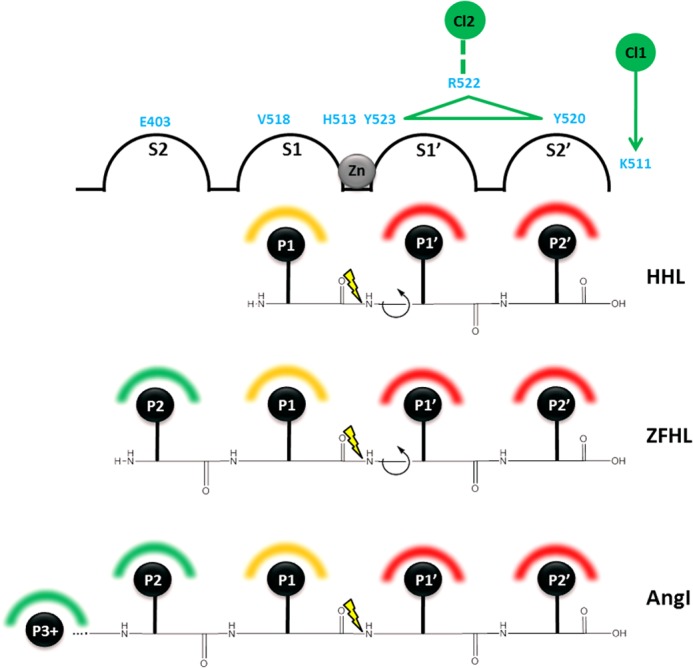
Somatic angiotensin-converting enzyme (sACE), a key regulator of blood pressure and electrolyte fluid homeostasis, cleaves the vasoactive angiotensin-I, bradykinin, and a number of other physiologically relevant peptides. sACE consists of two homologous and catalytically active N- and C-domains, which display marked differences in substrate specificities and chloride activation. A series of single substitution mutants were generated and evaluated under varying chloride concentrations using isothermal titration calorimetry. The x-ray crystal structures of the mutants provided details on the chloride-dependent interactions with ACE. Chloride binding in the chloride 1 pocket of C-domain ACE was found to affect positioning of residues from the active site. Analysis of the chloride 2 pocket R522Q and R522K mutations revealed the key interactions with the catalytic site that are stabilized via chloride coordination of Arg(522). Substrate interactions in the S2 subsite were shown to affect chloride affinity in the chloride 2 pocket. The Glu(403)-Lys(118) salt bridge in C-domain ACE was shown to stabilize the hinge-bending region and reduce chloride affinity by constraining the chloride 2 pocket. This work demonstrated that substrate composition to the C-terminal side of the scissile bond as well as interactions of larger substrates in the S2 subsite moderate chloride affinity in the chloride 2 pocket of the ACE C-domain, providing a rationale for the substrate-selective nature of chloride dependence in ACE and how this varies between the N- and C-domains.
Keywords: Angiotensin-1-converting Enzyme; Biophysics; Chloride Ion Activation; Crystallography; Enzymology; Hypertension; Protein Structure; Thermodynamics.
Figures
Similar articles
-
Angiotensin-I converting enzyme (ACE): structure, biological roles, and molecular basis for chloride ion dependence.Biol Chem. 2014 Oct;395(10):1135-49. doi: 10.1515/hsz-2014-0157. Biol Chem. 2014. PMID: 25205727 Review.
-
Kinetic and structural characterization of amyloid-β peptide hydrolysis by human angiotensin-1-converting enzyme.FEBS J. 2016 Mar;283(6):1060-76. doi: 10.1111/febs.13647. Epub 2016 Feb 9. FEBS J. 2016. PMID: 26748546 Free PMC article.
-
Structure-function discrimination of the N- and C- catalytic domains of human angiotensin-converting enzyme: implications for Cl- activation and peptide hydrolysis mechanisms.Protein Eng. 2003 Dec;16(12):993-1003. doi: 10.1093/protein/gzg122. Protein Eng. 2003. PMID: 14983080
-
Simulated interactions between angiotensin-converting enzyme and substrate gonadotropin-releasing hormone: novel insights into domain selectivity.Biochemistry. 2007 Jul 31;46(30):8753-65. doi: 10.1021/bi700253q. Epub 2007 Jul 3. Biochemistry. 2007. PMID: 17605472
-
Advances in Structural Biology of ACE and Development of Domain Selective ACE-inhibitors.Med Chem. 2019;15(6):574-587. doi: 10.2174/1573406415666190514081132. Med Chem. 2019. PMID: 31084594 Review.
Cited by
-
Knowledge-based structural models of SARS-CoV-2 proteins and their complexes with potential drugs.FEBS Lett. 2020 Jun;594(12):1960-1973. doi: 10.1002/1873-3468.13806. Epub 2020 May 25. FEBS Lett. 2020. PMID: 32379896 Free PMC article.
-
ACE2 and ACE: structure-based insights into mechanism, regulation and receptor recognition by SARS-CoV.Clin Sci (Lond). 2020 Nov 13;134(21):2851-2871. doi: 10.1042/CS20200899. Clin Sci (Lond). 2020. PMID: 33146371 Free PMC article. Review.
-
Molecular basis of human angiotensin-1 converting enzyme inhibition by a series of diprolyl-derived compounds.FEBS J. 2025 Mar;292(5):1141-1158. doi: 10.1111/febs.17384. Epub 2025 Jan 6. FEBS J. 2025. PMID: 39763019 Free PMC article.
-
ACE-domain selectivity extends beyond direct interacting residues at the active site.Biochem J. 2020 Apr 17;477(7):1241-1259. doi: 10.1042/BCJ20200060. Biochem J. 2020. PMID: 32195541 Free PMC article.
-
Census of halide-binding sites in protein structures.Bioinformatics. 2020 May 1;36(10):3064-3071. doi: 10.1093/bioinformatics/btaa079. Bioinformatics. 2020. PMID: 32022861 Free PMC article.
References
-
- Watermeyer J. M., Kroger W. L., Sturrock E. D., Ehlers M. R. (2009) Angiotensin-converting enzyme–New insights into structure, biological significance and prospects for domain-selective inhibitors. Curr. Enzyme Inhib. 5, 134–147
-
- Anthony C. S., Masuyer G., Sturrock E. D., Acharya K. R. (2012) Structure based drug design of angiotensin-I converting enzyme inhibitors. Curr. Med. Chem. 19, 845–855 - PubMed
-
- Corvol P., Eyries M., Soubrier F. (2004) Handbook of Proteolytic Enzymes, (Barrett A. J., Rawlings N. D., Woessner J. F., eds) pp. 332–346, Elsevier Academic Press, San Diego
-
- Hubert C., Houot A. M., Corvol P., Soubrier F. (1991) Structure of the angiotensin I-converting enzyme gene. Two alternate promoters correspond to evolutionary steps of a duplicated gene. J. Biol. Chem. 266, 15377–15383 - PubMed
Publication types
MeSH terms
Substances
Grants and funding
LinkOut - more resources
Full Text Sources
Other Literature Sources
Molecular Biology Databases
Miscellaneous
