. 2015 May;25(5):1330-47.
doi: 10.1093/cercor/bht326. Epub 2013 Dec 1.

Hypocretin (orexin) regulates glutamate input to fast-spiking interneurons in layer V of the Fr2 region of the murine prefrontal cortex

Affiliations

Hypocretin (orexin) regulates glutamate input to fast-spiking interneurons in layer V of the Fr2 region of the murine prefrontal cortex

Patrizia Aracri et al. Cereb Cortex. 2015 May.

Abstract

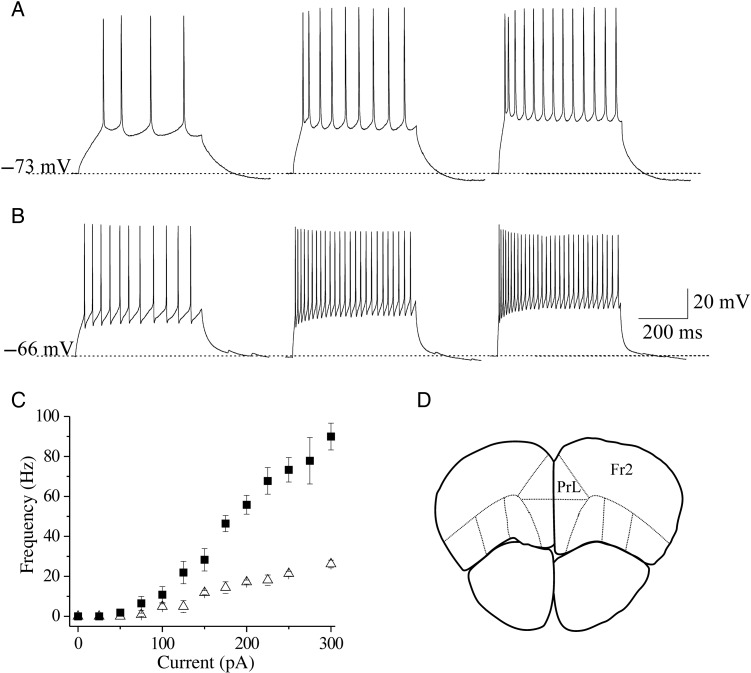
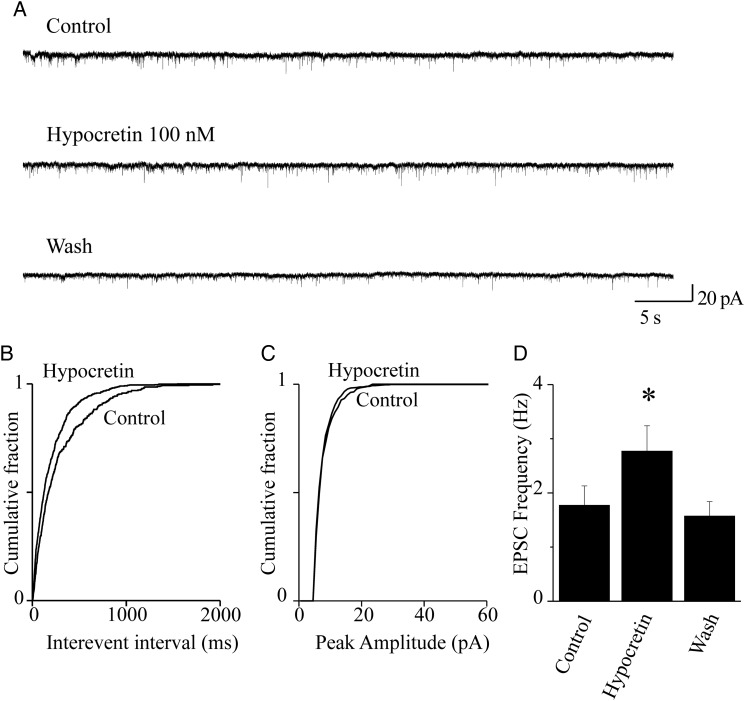
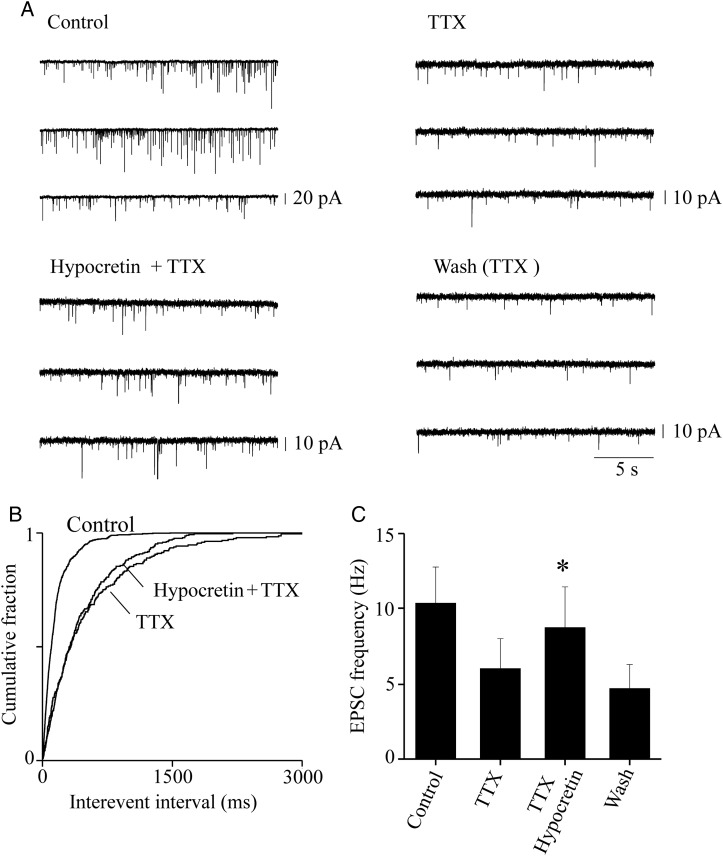
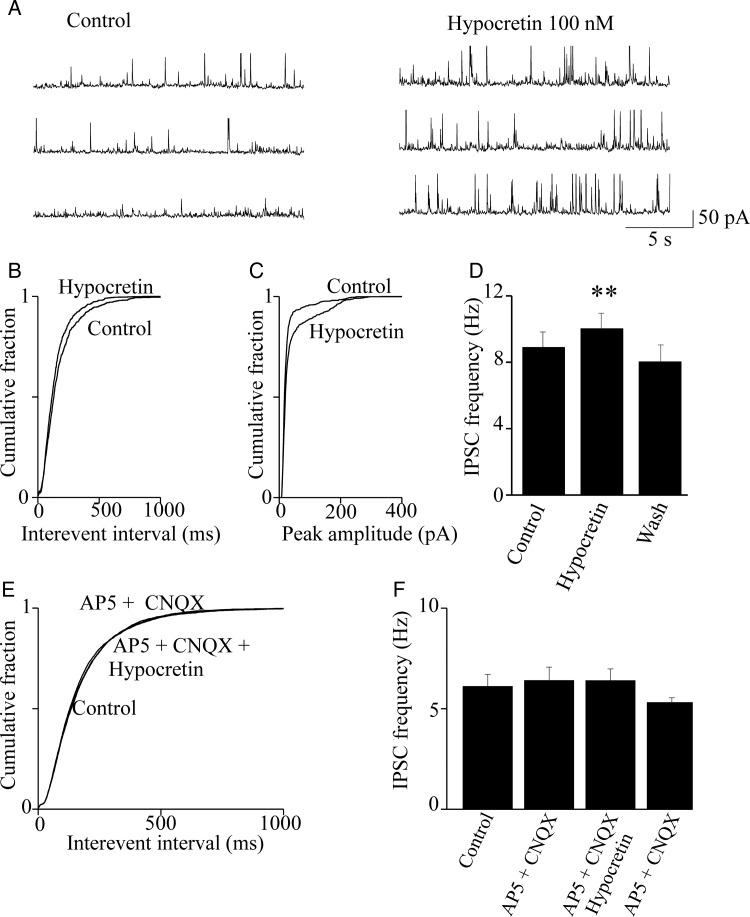
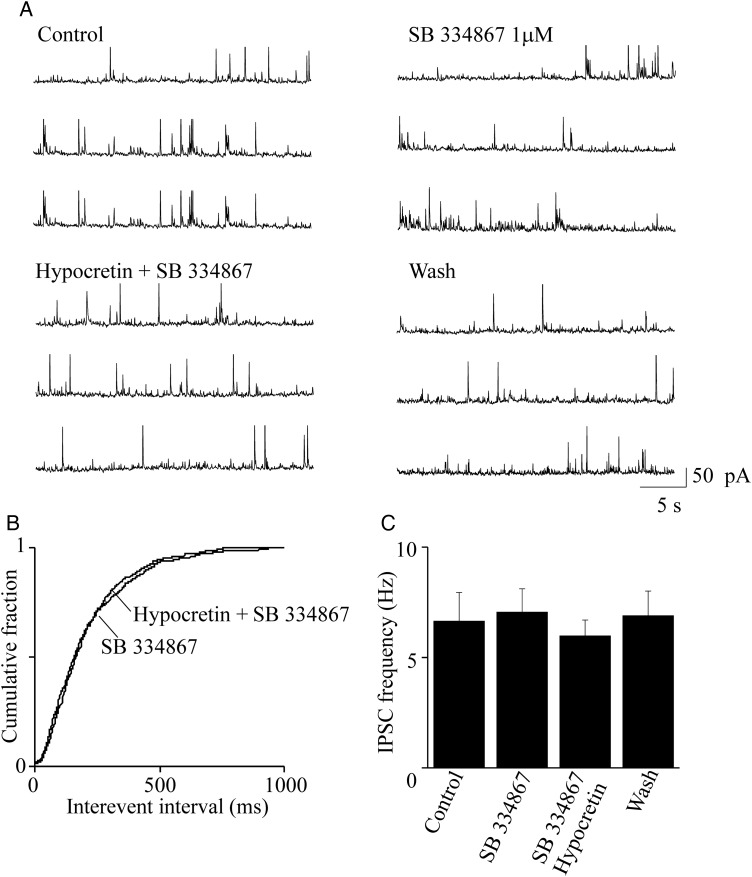
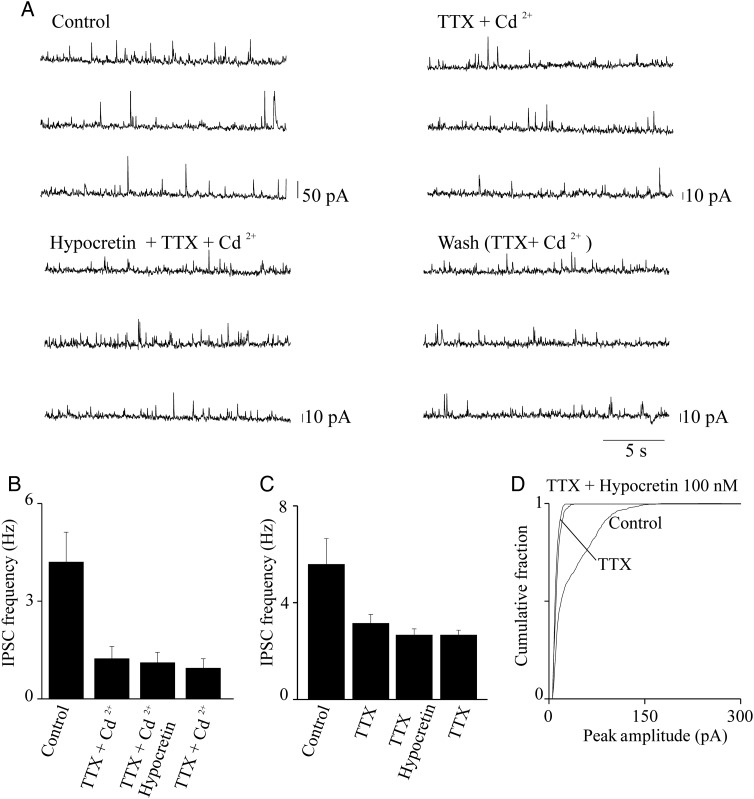
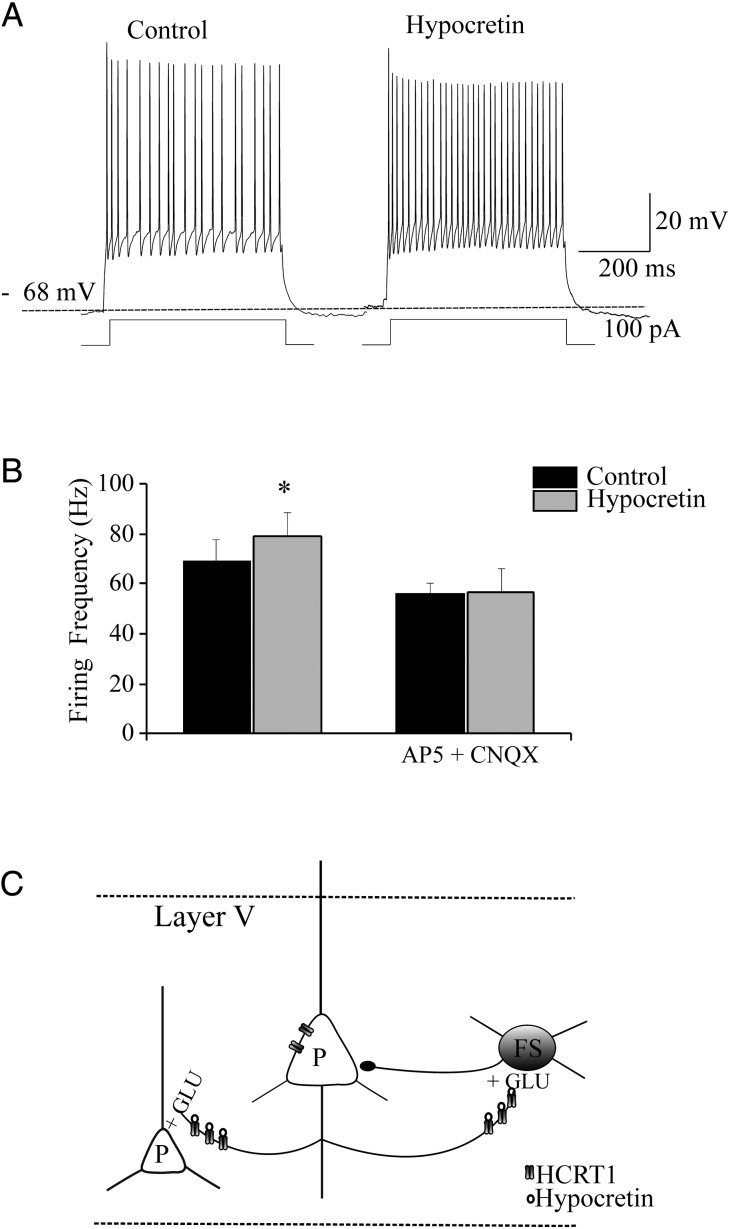
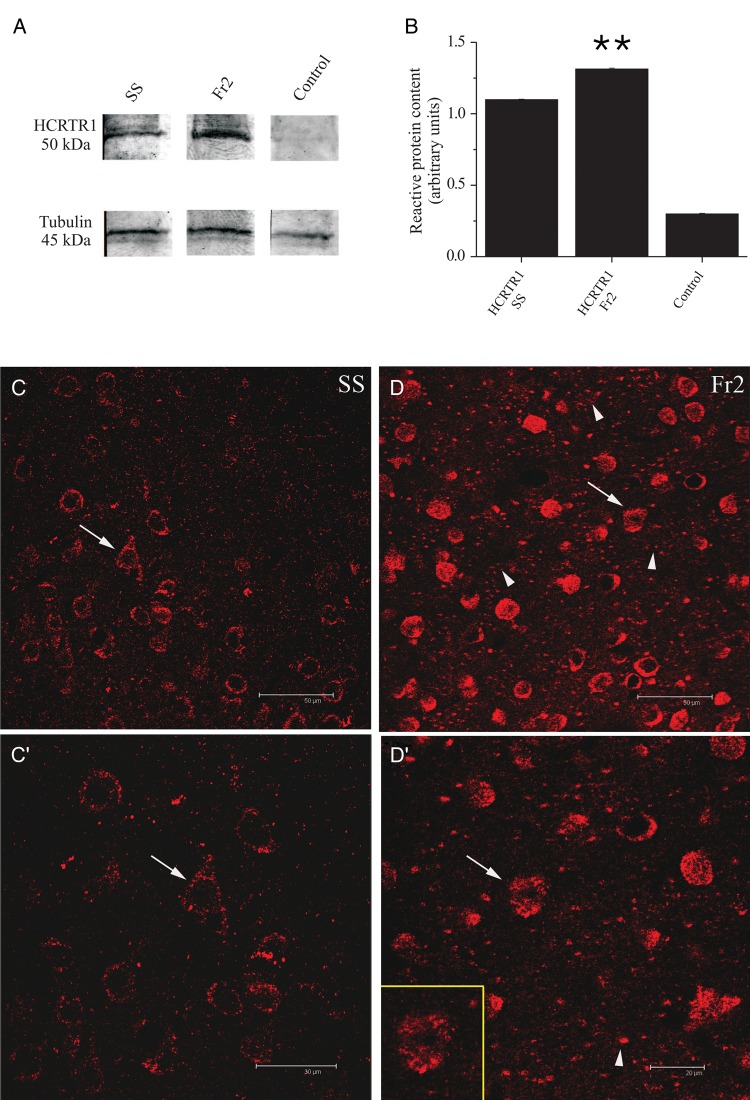
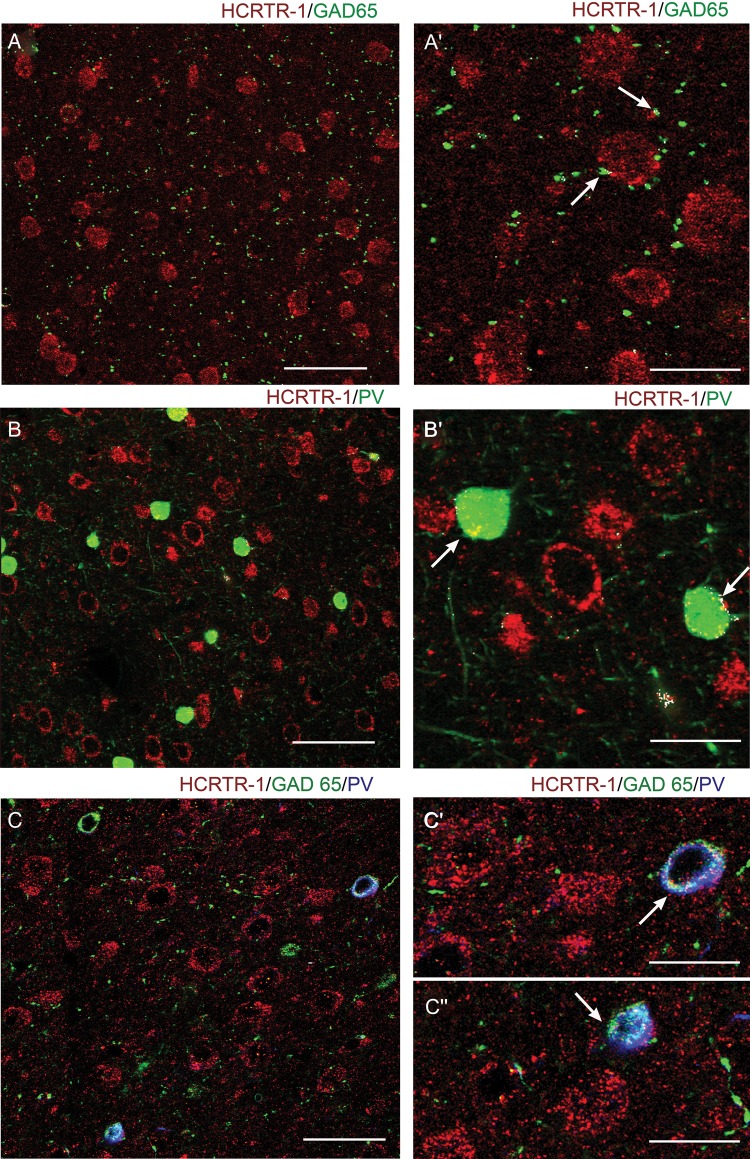
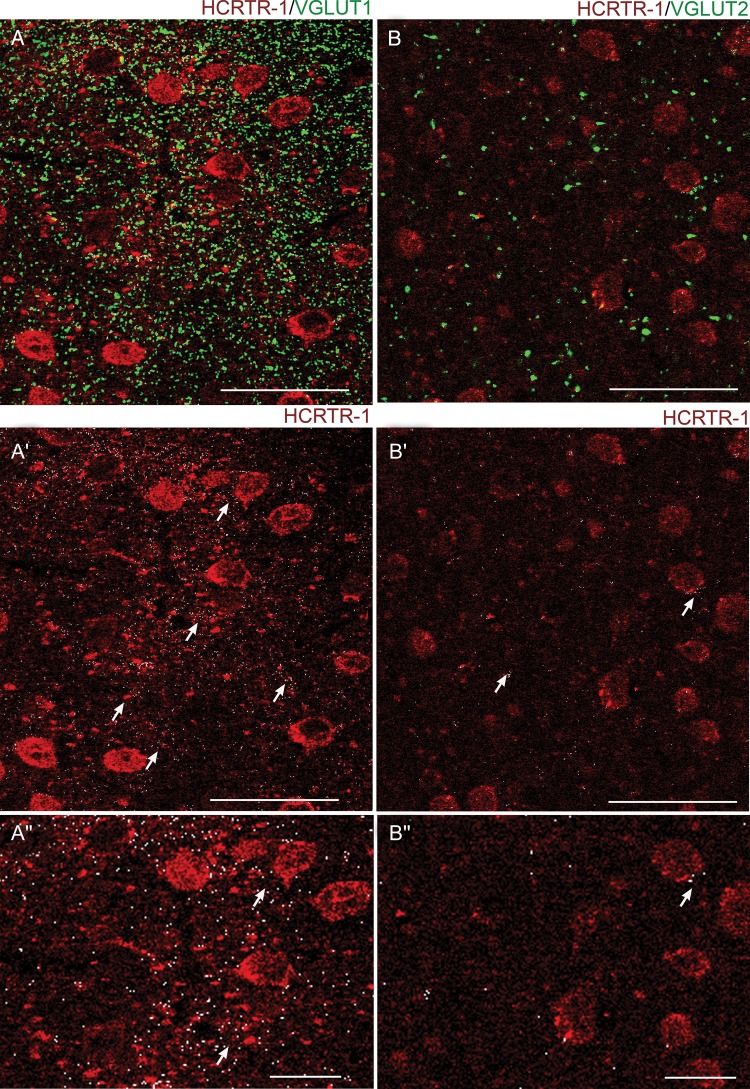
We studied the effect of hypocretin 1 (orexin A) in the frontal area 2 (Fr2) of the murine neocortex, implicated in the motivation-dependent goal-directed tasks. In layer V, hypocretin stimulated the spontaneous excitatory postsynaptic currents (EPSCs) on fast-spiking (FS) interneurons. The effect was accompanied by increased frequency of miniature EPSCs, indicating that hypocretin can target the glutamatergic terminals. Moreover, hypocretin stimulated the spontaneous inhibitory postsynaptic currents (IPSCs) on pyramidal neurons, with no effect on miniature IPSCs. This action was prevented by blocking 1) the ionotropic glutamatergic receptors; 2) the hypocretin receptor type 1 (HCRTR-1), with SB-334867. Finally, hypocretin increased the firing frequency in FS cells, and the effect was blocked when the ionotropic glutamate transmission was inhibited. Immunolocalization confirmed that HCRTR-1 is highly expressed in Fr2, particularly in layer V-VI. Conspicuous labeling was observed in pyramidal neuron somata and in VGLUT1+ glutamatergic terminals, but not in VGLUT2+ fibers (mainly thalamocortical afferents). The expression of HCRTR-1 in GABAergic structures was scarce. We conclude that 1) hypocretin regulates glutamate release in Fr2; 2) the effect presents a presynaptic component; 3) the peptide control of FS cells is indirect, and probably mediated by the regulation of glutamatergic input onto these cells.

Keywords: HCRTR; OXR1; SB-334867; VGLUT; fast-spiking; premotor.


Figures

Figure 1.
Figure 1.
Identification of pyramidal and FS cells in Fr2 layer V. (A) Regular spiking pyramidal cells were characterized by testing the firing response to consecutive depolarizing current steps, lasting 500 ms. The responses to above-threshold current steps (from left to right: 100, 200, and 300 pA) are shown for a representative neuron, showing the classical low-frequency firing with adaptation. (B) A similar procedure was applied to select FS cells. This neuron exhibited the high-frequency spiking typical of FS interneurons, with little adaptation. (C) Relation between injected current and firing frequency for regular spiking pyramidal cells (triangles; n = 11) and FS cells (squares; n = 14). Data points are average firing frequencies calculated from an ensemble of similar neurons, and plotted as a function of injected current. (D) A sketch is shown of a coronal murine brain section, in which the continuous lines mark the main functional regions typically recognized in the PFC. PrL, prelimbic region; Fr2, frontal area 2. Sections such as these were generally cut in the region between +2.68 and +2.10 mm from bregma.
Figure 2.
Figure 2.
Hypocretin 1 stimulates glutamate release onto FS neurons. (A) Spontaneous EPSCs were recorded from FS neurons at −70 mV. Current traces represent 60-s continuous recording, before (Control), during (Hypocretin 100 nM), and after (Wash) peptide application. Hypocretin increased EPSC frequency, in a reversible way. (B) Cumulative distribution of the EPSC interevent intervals, calculated from the same experiment as in (A), in the presence or absence of hypocretin, as indicated. The peptide significantly decreased the interevent intervals (P < 0.01, with KS test). (C) Cumulative distribution of the EPSC amplitudes, in the presence or absence of hypocretin, in the same neuron. The peptide produced no significant alteration of the EPSC amplitudes (NS with KS test). (D) Hypocretin 1 produced a significant stimulatory effect in 7 of 8 neurons tested. Bars give the average EPSC frequency calculated from these cells. The plotted values were calculated from 2-min continuous recording in the indicated conditions, at the steady state. On average, the neuropeptide produced an ∼60% increase in EPSC frequency (*0.01 < P < 0.05; comparison between hypocretin and control).
Figure 3.
Figure 3.
Presynaptic effect of hypocretin on glutamatergic terminals. (A) Sample EPSC traces recorded at −70 mV from a typical FS cell, during continuous recording in the indicated conditions. Application of 0.5 μM TTX produced the expected decrease of the EPSC amplitudes and frequency, thus revealing the miniature events. The mEPSC frequency was stimulated by 100 nM hypocretin 1, and the effect was reversible on washout. (B) Cumulative distribution of the EPSC interevent intervals in the same experiment, calculated from 2-min continuous recording in the indicated conditions. The frequency of the mEPSCs revealed by TTX was increased by hypocretin (P < 0.01, with KS test). (C) Similar results were obtained in 6 analogous experiments. In these experiments, mice were aged 25–30 days, to maximize the basal synaptic activity and thus avoid the risk of having too few miniature events for our analysis. To increase the number of miniature events in the presence of TTX, and thus Bars give the average mEPSC frequency, calculated for 2 min of continuous recording at the steady state, in the indicated conditions. Hypocretin produced an ∼50% increase in the average mEPSC frequency (*0.01 < P < 0.05; comparison between hypocretin+TTX and TTX). Full statistics are given in the main text.
Figure 4.
Figure 4.
Hypocretin stimulates spontaneous IPSCs in pyramidal neurons. (A) IPSC traces recorded from a typical pyramidal neurons at +10 mV. The IPSC frequency was increased by hypocretin 1 (100 nM) and abolished by bicuculline (10 μM; not shown). (B) Cumulative distribution of the interevent intervals calculated from the same experiment. Hypocretin significantly increased the event frequency (P < 0.01, with KS test). (C) In this experiment, hypocretin also increased the average IPSC amplitude, as is illustrated by the cumulative distribution of amplitudes in the presence and absence of hypocretin (P < 0.01, with KS test). (D) Similar results were obtained in 7 of 9 experiments. Bars give the average IPSC frequency in control condition, in the presence of hypocretin and after washout, as indicated. Bar values were calculated from 2-min continuous recording, at the steady state. Hypocretin produced an average increase of IPSC frequency of ∼15% (**P < 0.01; comparison between hypocretin and control). Full statistics are given in the main text. (E) Cumulative distribution of the spontaneous IPSC interevent intervals in a representative experiment, calculated in control condition, in the presence of 50 μM AP5 and 10 μM CNQX (AP5 + CNQX) and in the presence of AP5, CNQX, and hypocretin (AP5 + CNQX + Hypocretin). No significant difference was observed between treatments, as tested in each cell by the KS test. (F) Similar results were obtained in 7 experiments. Bars give the average IPSC frequency, in the indicated conditions. Data analysis was as in (D). No differences were observed between treatments (statistics are given in the main text).
Figure 5.
Figure 5.
Blocking HCRTR-1 inhibits the hypocretin-dependent stimulus of spontaneous IPSCs. (A) Representative spontaneous IPSCs recorded from a pyramidal neuron at +10 mV, in the indicated conditions. The effect of 1 μM SB 3 348 671 was tested in the absence and in the presence of 100 nM hypocretin 1. (B) Cumulative distribution of the interevent intervals calculated from the same experiment, in the indicated conditions. Treatment with the HCRTR-1 inhibitor prevented the stimulatory effect of hypocretin on IPSCs. The cumulative distributions of the interevent intervals in the presence SB 3 348 671 and in the presence of hypocretin + SB 3 348 671 were not significantly different (with KS test). (C) Similar results were obtained in 7 total experiments. Bars give the average steady-state IPSCs, in the indicated conditions, analyzed as in Figure 4. Hypocretin + SB 3 348 671 (SB) did not alter the average IPSC frequency, compared with both the control condition and treatment with the inhibitor alone. Detailed statistics are given in the main text.
Figure 6.
Figure 6.
Hypocretin is ineffective on miniature IPSCs. (A) IPSC traces at +10 mV, from a representative pyramidal neuron. Traces illustrate ∼60-s continuous recording before treatment (Control), in the presence of 0.5 μM TTX + 50 μM Cd2+ (TTX + Cd2+), in the presence of 0.5 μM TTX, 50 μM Cd2+, and 100 nM hypocretin 1 (Hypocretin + TTX + Cd2+), and after removal of hypocretin (Wash). In this experiment, treatment with TTX + Cd2+ revealed the miniature IPSC events, whose frequency was considerably lower than the frequency of the spontaneous IPSCs. Hypocretin did not significantly alter the frequency of these miniature events (as estimated with KS test; not shown). (B) Similar results were obtained in 6 total experiments. Bars give the average effect of the indicated treatments on the IPSC frequency, calculated for 2-min continuous recording at the steady state, in each indicated condition (n = 6). Hypocretin did not produce any significant increase in the miniature IPSC frequency, as detailed in the main text. (C) Average results obtained from 5 experiments carried out and analyzed as illustrated in (A) and (B), except that Cd2+ was not present. Hypocretin did not produce any significant alteration in the average frequency of the miniature IPSCs (statistics are given in the main text). Similar results were obtained in the presence of 500 nM hypocretin (n = 7).
Figure 7.
Figure 7.
Hypocretin accelerates action potential firing in FS cells. (A) Cell firing in a representative FS cell, recorded as illustrated in Figure 1. Application of hypocretin 1 (100 nM) accelerated the firing rate. (B) Bars show the average results on FS firing produced by hypocretin in a series of experiments on cells in the same mice litters, in the absence (left bars) or in the presence (right bars) of 50 μM AP5 and 10 μM CNQX. Hypocretin brought the FS-cell firing frequency from 69.1 ± 8.46 to 79.03 ± 9.9 Hz (*0.01 < P < 0.05; n = 5). No effect was produced by the peptide in the presence of AP5 and CNQX, when the FS-cell firing frequency was 56.26 ± 4.08 Hz in the absence and 56.5 ± 9.52 Hz in the presence of hypocretin (NS; n = 5). The effects of hypocretin on Vrest were overall minor. In the absence of AP5 and CNQX, hypocretin brought Vrest from −71.1 ± 1.25 to −67.7 ± 1.83 mV (NS, n = 5); whereas in the presence of the blockers hypocretin brought Vrest from −65.2 ± 1.93 to −63 ± 2.85 mV (NS; n = 5). (C) Schematic of the Fr2 layer V network, with reference to the actions of hypocretin on pyramidal (P) and FS neurons.
Figure 8.
Figure 8.
Western blot and immunocytochemical analysis of HCRTR-1 expression. (A) HCRTR-1 expression in membrane fractions of SS (lane 1) and Fr2 (lane 2). Data were obtained by using Mem-PER. The antibody against HCRTR-1 recognized a specific band with an apparent molecular mass of 50 kDa, consistent with the expression of the native HCRTR-1 (according to NP_001516.1 and Karteris et al. 2005). Equal protein loading was assayed by evaluating the total α-tubulin with a monoclonal anti-α-tubulin antibody as a loading control (lower panels; see Materials and Methods). Controls carried out using preadsorbed HCRTR-1 antiserum and with omission of primary HCRTR-1 antibody were completely negative (lane 3). (B) Comparison of the average intensity of the western blot bands calculated for 3 representative experiments, in the indicated conditions. Optical intensity was detected and analyzed as detailed in Materials and Methods. The immunoreactivity obtained with anti-HCRTR-1 was normalized to the one obtained with anti-α-tubulin, and the resulting ratios were plotted for both SS and Fr2, as indicated. In these tests, HCRTR-1 gave a mean value of 1.31 ± 0.006 for Fr2 and 1.10 ± 0.004 for SS (**P < 0.01; comparison between HCRTR-1 in SS and HCRTR-1 in Fr2). (C), (C′), (D), and (D′) illustrate the immunocytochemical analysis of HCRTR-1 expression. In layer V of SS (C), the HCRTR-1 granular immunoreactivity was mainly detected at the level of neuronal cell bodies sometimes clearly identifiable as pyramidal neurons, based on morphology (arrows). (C′) gives a higher magnification detail of (C). In layer V of Fr2 (D), the HCRTR-1 positive (+) signal was considerably more intense than in SS and was detectable not only in numerous cell bodies (arrows and inset in D′), but also in neuropilar processes of different caliber (arrowheads). (D′) gives a higher magnification detail of (C). Scale bars: 50 μm (C, D); 30 μm (C′); 20 μm (D′).
Figure 9.
Figure 9.
Expression of HCRTR-1 in GABAergic cells. Confocal microscopy images of double and triple immunofluorescent staining for HCRTR-1, glutamic acid decarboxylase (65 kDa form; GAD65), and/or parvalbumin (PV) in layer V of Fr2. (A) and (A′) show, at different magnification, the distribution of HCRTR-1 (red) and GAD65 (green). Very little colocalization (white signal) characterized hypocretin receptor and GABAergic inhibitory terminals (arrows) contacting HCRTR-1+ neurons or processes. (B) and (B′) show, at different magnification, the distribution of HCRTR-1 (red) and PV (green). Colocalization (white) was detected only in cell bodies of a few interneuronal inhibitory cells (arrows). (C), (C′), and (C″) show, at different magnification, immunolabeling of HCRTR-1 (red), GAD65 (green), and PV (blue). White signal marks triple colocalization. A subpopulation of PV + GABAergic (GAD65+) interneurons expressed HCRTR-1. Scale bars: 50 μm (A, C); 60 μm (B); 25 μm (A′); 20 μm (B′, C′, C″).
Figure 10.
Figure 10.
Expression of HCRTR-1 in VGLUT1+ and VGLUT2+ glutamatergic fibers in layer V of Fr2. (A) Confocal microscopy images of double immunofluorescent staining for HCRTR-1 (red) and VGLUT1 (green). White spots are colocalization puncta. For better distinction of the 2 signals, (A′) only shows the HCRTR-1 signal (red) plus the white colocalization puncta. (A″) is a higher magnification version of (A′). Overall, a high density of VGLUT1+ synaptic terminals was observed in the neuropil of Fr2 (A). Moreover, a high degree of colocalization was detected for our markers (see also the arrows in A′). (B) Confocal microscopy images of double immunofluorescent staining for HCRTR-1 (red) and VGLUT2 (green). White spots are colocalization puncta. For better distinction of the 2 signals, (B′) only shows the HCRTR-1 signal, plus the white colocalization puncta. (B″) is a higher magnification version of (B′). Only a few large VGLUT2+ synaptic terminals were present in layer V among the HCRTR-1+ elements. The colocalization (white) was scarce as also indicated by the arrows in (B′). Scale bars: 50 μm for (A), (A′), (B), (B′); 20 μm for (A″) and (B″).

References

    1. Adamantidis AR, Zhang F, Aravanis AM, Deisseroth K, de Lecea L. 2007. Neural substrates of awakening probed with optogenetic control of hypocretin neurons. Nature. 450:420–424. - PMC - PubMed
    1. Ammoun S, Holmqvist T, Shariatmadari R, Oonk HB, Detheux M, Parmentier M, Akerman KE, Kukkonen JP. 2003. Distinct recognition of OX1 and OX2 receptors by orexin peptides. J Pharmacol Exp Ther. 305:507–514. - PubMed
    1. Aracri P, Amadeo A, Pasini ME, Fascio U, Becchetti A. 2013. Regulation of glutamate release by heteromeric nicotinic receptors in layer V of the secondary motor region (Fr2) in the dorsomedial shoulder of prefrontal cortex in mouse. Synapse. 67:338–357. - PubMed
    1. Aracri P, Consonni S, Morini R, Perrella M, Rodighiero S, Amadeo A, Becchetti A. 2010. Tonic modulation of GABA release by nicotinic acetylcholine receptors, in layer V of the murine prefrontal cortex. Cereb Cortex. 20:1539–1555. - PubMed
    1. Bacci A, Rudolph U, Huguenard JR, Prince DA. 2003. Major differences in inhibitory synaptic transmission onto two neocortical interneuron subclasses. J Neurosci. 23:9664–9674. - PMC - PubMed

Publication types

MeSH terms