. 2013 Dec 9;203(5):767-83.
doi: 10.1083/jcb.201305027. Epub 2013 Dec 2.

β-Globin cis-elements determine differential nuclear targeting through epigenetic modifications

Affiliations

β-Globin cis-elements determine differential nuclear targeting through epigenetic modifications

Qian Bian et al. J Cell Biol. .

Abstract

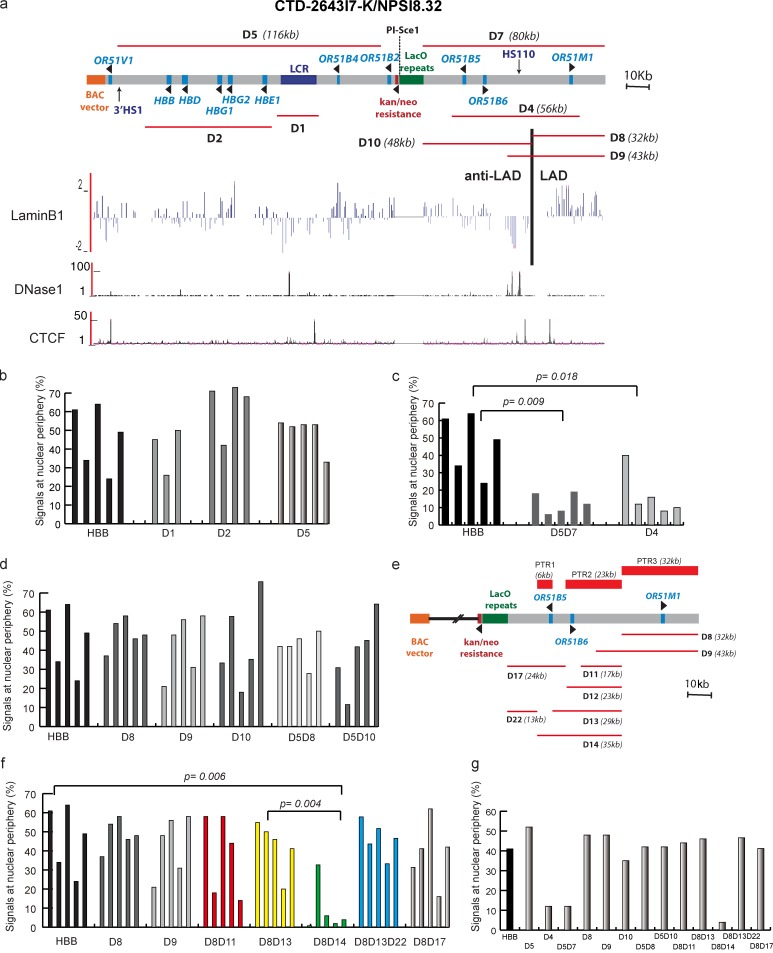
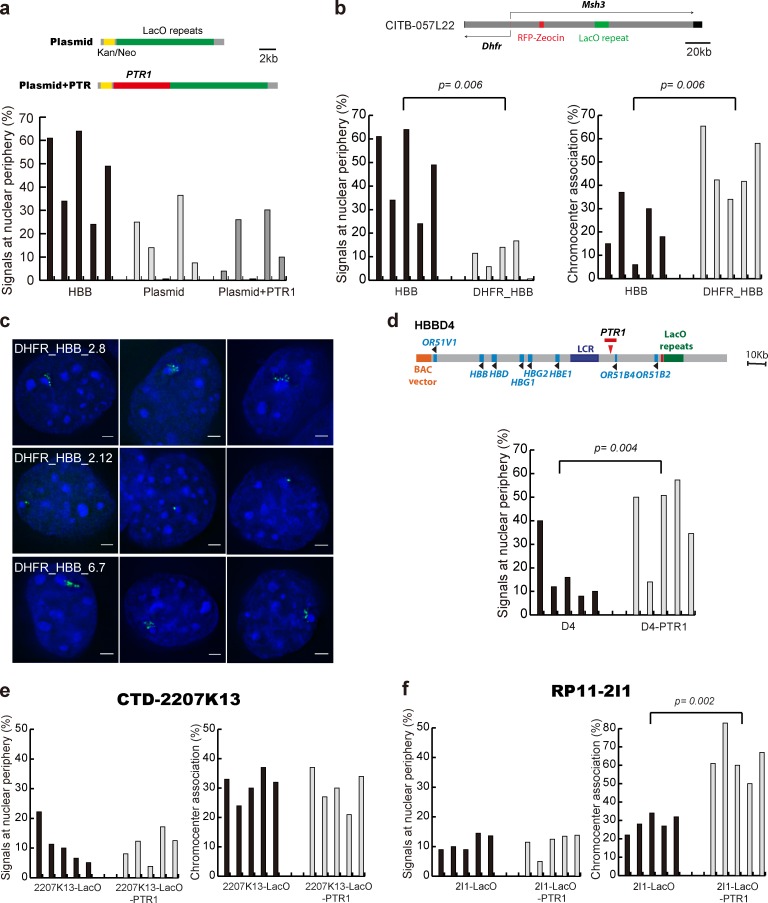
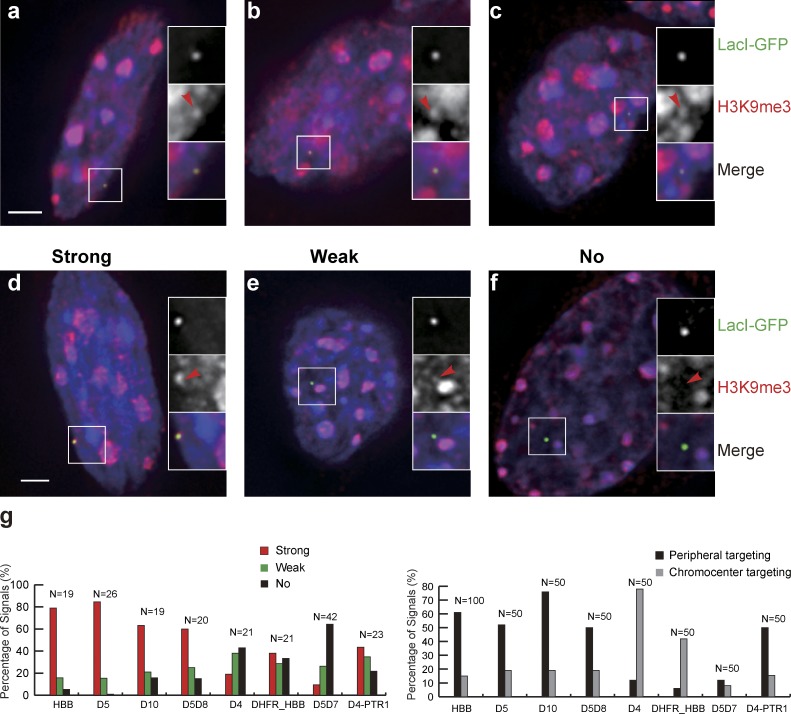
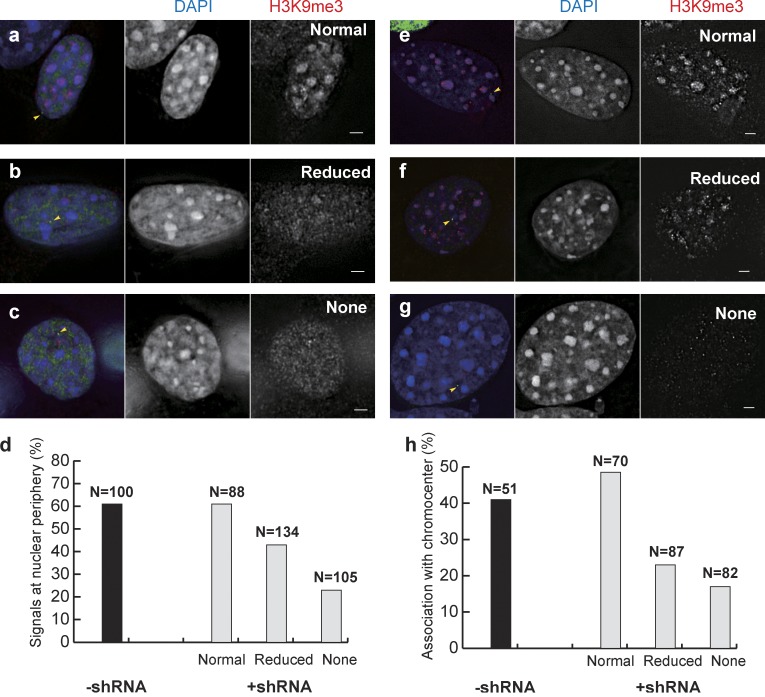
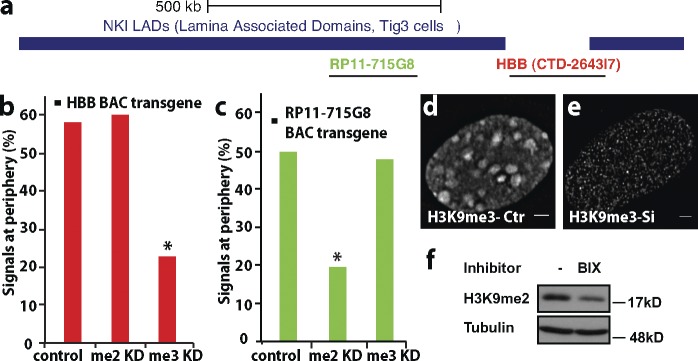
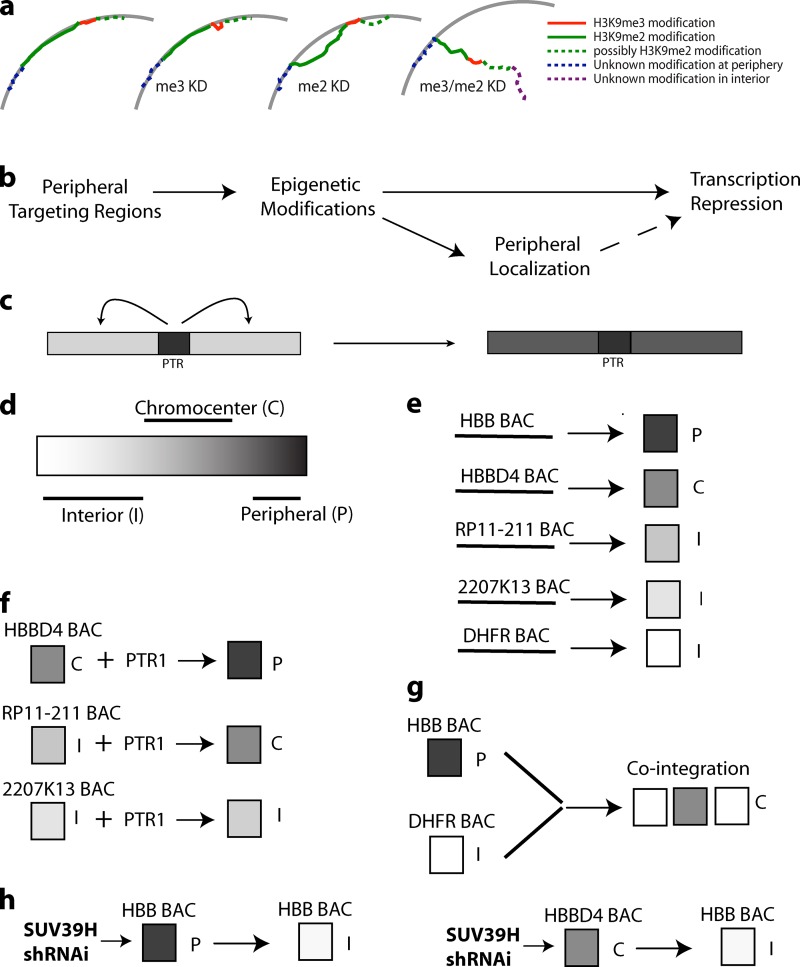
Increasing evidence points to nuclear compartmentalization as a contributing mechanism for gene regulation, yet mechanisms for compartmentalization remain unclear. In this paper, we use autonomous targeting of bacterial artificial chromosome (BAC) transgenes to reveal cis requirements for peripheral targeting. Three peripheral targeting regions (PTRs) within an HBB BAC bias a competition between pericentric versus peripheral heterochromatin targeting toward the nuclear periphery, which correlates with increased H3K9me3 across the β-globin gene cluster and locus control region. Targeting to both heterochromatin compartments is dependent on Suv39H-mediated H3K9me3 methylation. In different chromosomal contexts, PTRs confer no targeting, targeting to pericentric heterochromatin, or targeting to the periphery. A combination of fluorescent in situ hybridization, BAC transgenesis, and knockdown experiments reveals that peripheral tethering of the endogenous HBB locus depends both on Suv39H-mediated H3K9me3 methylation over hundreds of kilobases surrounding HBB and on G9a-mediated H3K9me2 methylation over flanking sequences in an adjacent lamin-associated domain. Our results demonstrate that multiple cis-elements regulate the overall balance of specific epigenetic marks and peripheral gene targeting.


Figures

Figure 1.
Figure 1.
200-kb human β-globin BAC transgene targets to nuclear periphery similarly to endogenous β-globin locus. (a–c) FISH shows peripheral localization of endogenous β-globin locus in human BJ-hTERT (a) and mouse NIH 3T3 (b) fibroblasts but interior localization for the α-globin locus in mouse NIH 3T3 cells (c; DAPI [blue], FISH [green], and lamin A immunostaining [red]). Arrowheads show DNA FISH signals. (d–f) Peripheral localization of HBB BAC identified by EGFP-LacI binding (green) in HBB C3 NIH 3T3 cell clone using DAPI staining (blue; d), lamin A immunostaining (red; e), or nuclear pore staining (red; f) to define the nuclear periphery. Arrowheads show the HBB transgenes. (g) Fraction of cells with peripheral localization in each NIH 3T3 subclone for HBB (black) or DHFR (green) BAC transgenes as compared with endogenous β-globin loci (HBB) in human BJ-hTERT (dark gray) or mouse NIH 3T3 (red) cells or α-globin loci (HBA) in human BJ-hTERT cells. HBB BAC (no LacO; yellow) refers to FISH measurements from a mixed population of stable NIH 3T3 clones with HBB BAC with just a selectable marker but no LacO repeat inserted. Random shows a fraction of DAPI staining within 0.5 µm from the periphery. At least 50 cells from each BAC transgene NIH 3T3 cell clone and ≥45 cells for each endogenous gene FISH experiment were analyzed. Bars, 2 µm.
Figure 2.
Figure 2.
Sequence dissection of β-globin BAC reveals three peripheral PTRs. (a) Map of ∼200-kb human β-globin BAC aligned with the Lamin B1 DamID (human fibroblast Tig3 cells), DNase1 hypersensitivity (normal human lung fibroblasts), and CTCF binding (normal human lung fibroblasts) maps from the University of California, Santa Cruz, Genome Browser. Red lines indicate specific deletions made. (b–d, f, and g) Statistics for BAC transgene peripheral localization in independent NIH 3T3 subclones. (b) The LCR (D1), β-globin gene cluster (D2), and entire 116-kb region (D5) encompassing the β-globin locus, including the UHR and 3′ HS1; all are dispensable (D5) for peripheral localization. (c) Loss of peripheral targeting by the D5D7 double deletion, a control containing mostly BAC vector backbone and Tn5 transposon sequence, and the D4 deletion suggests that specific cis-elements outside the β-globin locus are required for targeting. (d) At least two functionally redundant regions within the D4 region are sufficient for peripheral targeting because D8, D9, D10, and double deletions D5D8 and D5D10 BACs display similar peripheral targeting. (e–g) Further sequence dissection reveals at least three PTRs sufficient for peripheral targeting. (e) Additional deletions relative to PTR locations (red bars) as shown for ∼80 kb of the 3′ end of BAC. kan/neo, kanamycin/neomycin. (f) Nested set of deletions reveals 6.3-kb PTR1 by loss of peripheral targeting in D8D14 deletion and persistence of peripheral targeting in D8D13D22 triple deletion, PTR2 by persistence of peripheral targeting in D8D17 double deletion, and PTR3 by D8 deletion. (g) Summary of sequence dissection showing median peripheral targeting levels for five cell clones analyzed for each BAC shown. Distances between BAC transgenes and nuclear periphery were measured in ≥50 cells for each cell clone.
Figure 3.
Figure 3.
Competition between nuclear peripheral versus chromocenter targeting. (a) D4 and D8D14 BAC transgenes exhibit significantly higher percentages of chromocenter association compared with intact (HBB) or D5 deletion (HBBD5) β-globin BAC transgenes. (b) Representative cells from three independent cell clones showing association of HBBD4 transgenes (green) with chromocenters. Blue, DNA DAPI staining. Bars, 2 µm. The presented images were collected in several different experiments and using different exposure times, as appropriate to each particular cell. (c) Stacked bar plots show a near constant sum of peripheral or chromocenter transgene targeting for multiple, independent cell clones carrying HBB, HBBD4, or HBBD5 transgenes or a mixed population of stably selected cell clones for HBB BAC transgenes not containing LacO repeats, suggesting competition between targeting to the nuclear periphery versus chromocenter. (a and c) Localization of BAC transgenes to either the nuclear periphery or chromocenter was measured in ≥50 cells for each cell clone. (d and e) Quantitative real-time PCR analysis of relative mRNA expression levels, normalized by copy number, for β-globin (HBB), olfactory receptor (OR), and selectable marker (kanamycin/neomycin [KN]) genes in cell clones containing either HBB BAC or HBBD4 BAC. Expression per gene copy was normalized relative to the expression in the cell clone containing HBB BAC (d) or the expression of the endogenous mouse HBB gene (e). Data show means ± SEM from three independent experiments.
Figure 4.
Figure 4.
Peripheral targeting activity of PTRs is context specific. Histograms showing targeting frequency to nuclear periphery versus chromocenter for five independent clones containing different plasmid or BAC constructs. (a) PTR1 does not confer targeting to the nuclear periphery when placed in a plasmid containing a 256 mer lac operator (LacO) repeat. (top) Plasmid maps with vector backbone (gray), PTR1 (red), and kanamycin/neomycin (Kan/Neo)-selectable marker (yellow). (b) Cointegrated DHFR and β-globin BACs (DHFR_HBB) target with high frequency to chromocenter rather than the peripheral targeting seen for HBB BACs alone. Map of ∼180-kb DHFR BAC. Green, LacO; red, Zeocin-selectable marker. (c) Examples of chromocenter association for several independent clones with varying size; cointegrated DHFR/HBB BAC transgene arrays LacO staining (green) and DAPI DNA staining (blue). Bars, 2 µm. The presented images were collected in several different experiments and using different exposure times, as appropriate to each particular cell. (d) Insertion of the 6.3-kb PTR1 to HBBD4 BAC by transposon restores peripheral targeting. (top) Map showing PTR containing transposon (red arrowhead). (e and f) Whereas insertion of PTR1 into BAC CTD-2207K13 changes neither peripheral nor chromocenter targeting (e), PTR1 insertion into BAC RP11-2I1 significantly increases chromocenter, but not peripheral, targeting. Localization of BAC transgenes to either the nuclear periphery or chromocenter was measured in ≥50 cells for each cell clone.
Figure 5.
Figure 5.
Differential targeting to the nuclear periphery versus chromocenter correlates with H3K9me3 levels over BAC transgenes. (a–f) BAC transgene locations (EGFP-LacI staining), H3K9me3 immunostaining, DAPI (blue). Enlarged insets show regions of magnification with red arrowheads in red channel (middle) pointing to location of transgenes in green (top) channel. (a–c) HBB BAC transgene locations in clone HBB-C3 overlap with H3K9me3 immunostaining foci regardless of whether transgenes are located at nuclear periphery (a), chromocenter (b), or interior (c). (d–f) Examples from clone HBB C3 showing strong (d), weak (e), or no (f) H3K9me3 signals over the BAC transgenes. (g) Strength of H3K9me3 immunostaining over different BAC transgenes (left) correlates with differential targeting of BAC transgenes (right) to nuclear periphery versus chromocenter. Bars, 2 µm. Data shown for each BAC are pooled from at least two independent experiments.
Figure 6.
Figure 6.
ChIP-qPCR measurements of context-specific H3K9me3 modifications over PTR1 and HBB BAC transgenes. (a) Map of HBB BAC with location of primers used for ChIP-qPCR; primer spacing was ∼1 kb over PTR1 but ∼5 kb elsewhere. (b–d) ChIP-qPCR measurements of H3K9me3 levels with the percent input values normalized by scaling linearly between 0 (GAPDH promoter) and 1 (IAP transposon; see Results H3K9me3 ChIP over PTR1 and the HBB locus and its correlation with H3K9m3 immunofluorescence and nuclear localization section). (b) Three biological replicates (A, B, and C) show reproducibility of H3K9me3 ChIP over HBB BAC with consistent peak over PTR1. (c) H3K9me3 ChIP values of full-length HBB BAC (green) versus HBBD4 BAC deleted of all PTRs (red) or HBBD4 BAC with PTR1 reinserted at arrow location (blue; inset shows PTR1 values with actual orientation). (d) H3K9me3 ChIP values for HBB BAC by itself or intact HBB BAC flanked by transcriptionally active DHFR BAC transgenes. (e) Mean H3K9me3 ChIP levels are lower for HBBD4 relative to HBB or HBBD4 + PTR1 BACs. (f) Mean H3K9me3 immunofluorescence (IF) levels are similarly reduced for HBBD4 versus HBB transgenes using a normalized, linear scaling of immunofluorescence values between DAPI regions with low immunofluorescence (0) and chromocenter immunofluorescence (1) (see Results section). (g) Normalized mean H3K9me3 ChIP values are decreased over PTR1 in plasmid transgenes relative to HBB, HBBD4 + PTR1, or HBB flanked by DHFR BAC transgenes. (h) Reduced H3K9me3 mean, normalized values for an ∼100-kb HBB region (primer pairs 2–18) without PTRs in HBBD4 BAC lacking PTRs but also in full-length HBB BAC transgenes flanked by DHFR BACs. (c–h) Error bars show SEM. (e–h) Statistical significance: *, P < 0.05; **, P < 0.01.
Figure 7.
Figure 7.
Reducing H3K9 methylation inhibits β-globin BAC targeting to periphery and chromocenter. (a–d) Reduced peripheral targeting of HBB clone C3 cells with increased reduction of H3K9me3. (a–c, left) HBB C3 cells after combined Suv39H1 and Suv39H2 shRNA knockdown showing normal level (a), reduced level (b), or no (c) H3K9me3 staining. (d) Statistics for peripheral targeting. (e–h) Reduced association with chromocenter of HBBD4 BAC transgenes with increased reduction of H3K9me3. (e–g) HBBD4 clone C40.10 cells after combined Suv39H1 and Suv39H2 shRNAs knockdown showing normal (e), reduced (f), and no (g) H3K9me3 immunostaining. (h) Statistics for chromocenter association. (a–c and e–g) Green, EGFP-LacI; arrowheads indicate BAC transgenes. (middle) DAPI staining. (right) H3K9me3 staining. Bars, 2 µm. Data shown are pooled from at least three independent experiments.
Figure 8.
Figure 8.
H3K9me3 and H3K9me2 double knockdown inhibits peripheral targeting of endogenous human β-globin locus (a) Schematic of an ∼2.5-Mbp region showing human β-globin locus and its flanking LAD regions (Lamin B1 DamID, human fibroblast Tig3 cells, hg19 assembly; University of California, Santa Cruz, Genome Browser). DNA FISH BAC probes shown below the map as black lines are labeled red for HBB and green for LAD sequences. chr, chromosome. (b–e) Representative DNA FISH images showing classes of HBB (red) and adjacent LAD localization (green). Gray, DAPI. (b) HBB and LAD both interior. (c–c″″) HBB and LAD both peripheral. (d and e) Polarized orientation with HBB locus at the periphery and LAD extended into the interior (d) or LAD locus attached at one end to the periphery but extended such that HBB is in the interior (e). (f–i) statistics for these different localization classes (b–e). Suv39H (H3K9me3 [me3] knockdown [KD]) knockdown or G9a (H3K9me2 [me2] knockdown) inhibition did not change the localization of HBB; however, double knockdown of H3K9me3 and H3K9me2 significantly reduces the preferential peripheral localization of HBB. (e and i) The polarized orientation with the flanking LAD attached peripherally at its distal end suggests existence of a third tethering mechanism, independent of Suv39H and G9a (Fig. 10 a). n > 100; data shown are pooled from at least three independent experiments. Bars, 2 µm. Insets are at 2×. Statistical significance: *, P < 0.05.
Figure 9.
Figure 9.
Independent peripheral targeting mechanisms for HBB versus LAD BAC transgenes. (a) Schematic of HBB (CTD-2643I7) and LAD (RP11-715G8) BACs aligned relative to flanking LAD sequence (labeling as in Fig. 8). (b) Peripheral targeting of HBB BAC transgene is inhibited after Suv39H knockdown (H3K9me3 [me3] knockdown [KD]) but not G9a inhibition (H3K9me2 [me2] knockdown). (c) Peripheral targeting of RP11-715G8 BAC transgene is inhibited after G9a inhibition (H3K9me2 knockdown) but not after Suv39H (H3K9me3 knockdown). (d and e) Normal (d) or reduced (e) H3K9me3 immunostaining after scrambled (d) or combined Suv39H1 and Suv39H2 shRNA (e). Ctr, control. (f) H3K9me2 Western Blot before (−) and after (+) BIX01294 G9a inhibition (Tubulin loading control). (b and c) n > 50; data shown are pooled from at least three independent experiments. Bars, 2 µm. Statistical significance: *, P < 0.01.
Figure 10.
Figure 10.
Working model for HBB locus nuclear targeting. (a) At least two independent peripheral targeting mechanisms act on adjacent sequences to anchor the HBB locus and surrounding sequences to the periphery: a Suv39H/H3K9me3 (me3)-dependent mechanism mediated by PTR sequences near the HBB locus (red), a G9a/H3K9me2 (me2)-dependent mechanism mediated by sequences in left flanking LAD region (green; possibly also in right flanking LAD, dotted green), and a likely third, uncharacterized mechanism acting to tether distal LAD after combined Suv39H and G9a knockdown/inhibition (dotted blue). KD, knockdown. (b) Peripheral targeting regions (PTRs) induce epigenetic modifications, leading to inhibition of gene expression and, in a fraction of cells, association with the nuclear periphery. Peripheral association may in turn reinforce gene repression. (c) Nucleation of H3K9me3 by PTR and its propagation, presumably with other epigenetic marks, to flanking genomic regions. (d) Epigenetic modifications continuum depicted as a white to black gradient with targeting to the nuclear interior (I; white), chromocenter (C; gray), or periphery (P; black) dependent on position within this continuum. (e) Cis-elements establish epigenetic states characteristic for each BAC transgene, resulting in differential nuclear targeting. (f) Addition of PTR1 shifts this continuum toward the black, altering nuclear targeting. (g) Long-range influence of cis-elements within DHFR BAC transgene shifts the epigenetic state of cointegrated HBB BAC transgenes from black (peripheral) to gray (chromocenter). (h) Reducing H3K9me3 by Suv39H KD shifts the epigenetic state toward white.

References

    1. Agard D.A., Hiraoka Y., Shaw P., Sedat J.W. 1989. Fluorescence microscopy in three dimensions. Methods Cell Biol. 30:353–377 10.1016/S0091-679X(08)60986-3 - DOI - PubMed
    1. Andrulis E.D., Neiman A.M., Zappulla D.C., Sternglanz R. 1998. Perinuclear localization of chromatin facilitates transcriptional silencing. Nature. 394:592–595 10.1038/29100 - DOI - PubMed
    1. Bailey T.L., Elkan C. 1994. Fitting a mixture model by expectation maximization to discover motifs in biopolymers. Proc. Int. Conf. Intell. Syst. Mol. Biol. 2:28–36 - PubMed
    1. Belmont A.S., Hu Y., Sinclair P.B., Wu W., Bian Q., Kireev I. 2010. Insights into interphase large-scale chromatin structure from analysis of engineered chromosome regions. Cold Spring Harb. Symp. Quant. Biol. 75:453–460 10.1101/sqb.2010.75.050 - DOI - PMC - PubMed
    1. Bender M.A., Byron R., Ragoczy T., Telling A., Bulger M., Groudine M. 2006. Flanking HS-62.5 and 3′ HS1, and regions upstream of the LCR, are not required for beta-globin transcription. Blood. 108:1395–1401 10.1182/blood-2006-04-014431 - DOI - PMC - PubMed

Publication types