. 2014 Feb 15;20(4):912-25.
doi: 10.1158/1078-0432.CCR-13-2281. Epub 2013 Dec 2.

BET bromodomain inhibition of MYC-amplified medulloblastoma

Affiliations

BET bromodomain inhibition of MYC-amplified medulloblastoma

Pratiti Bandopadhayay et al. Clin Cancer Res. .

Abstract

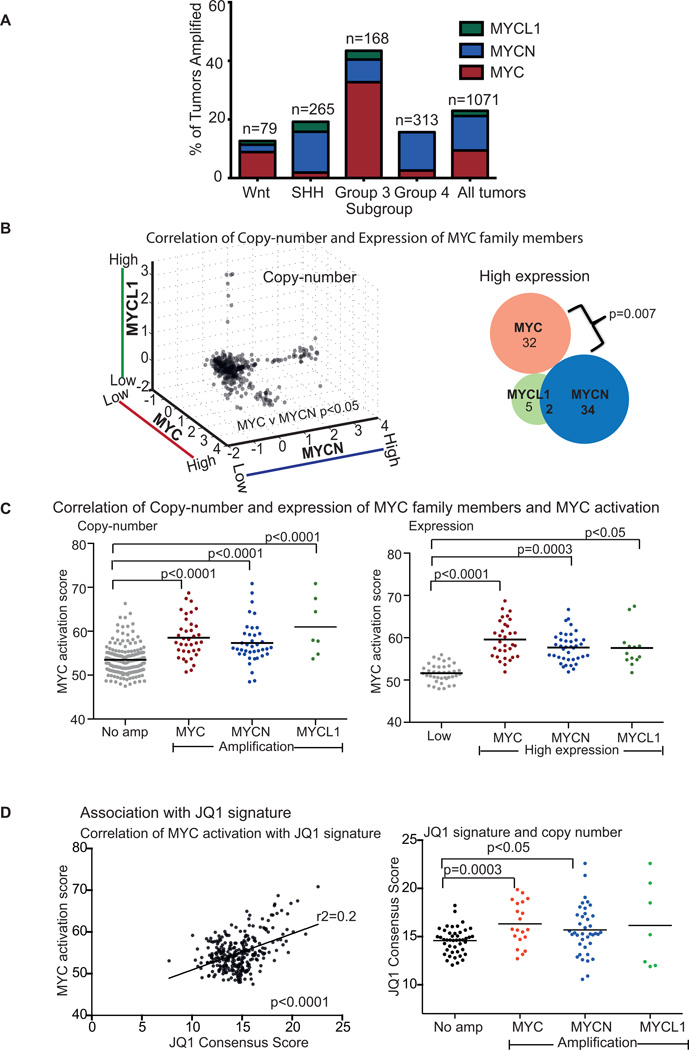
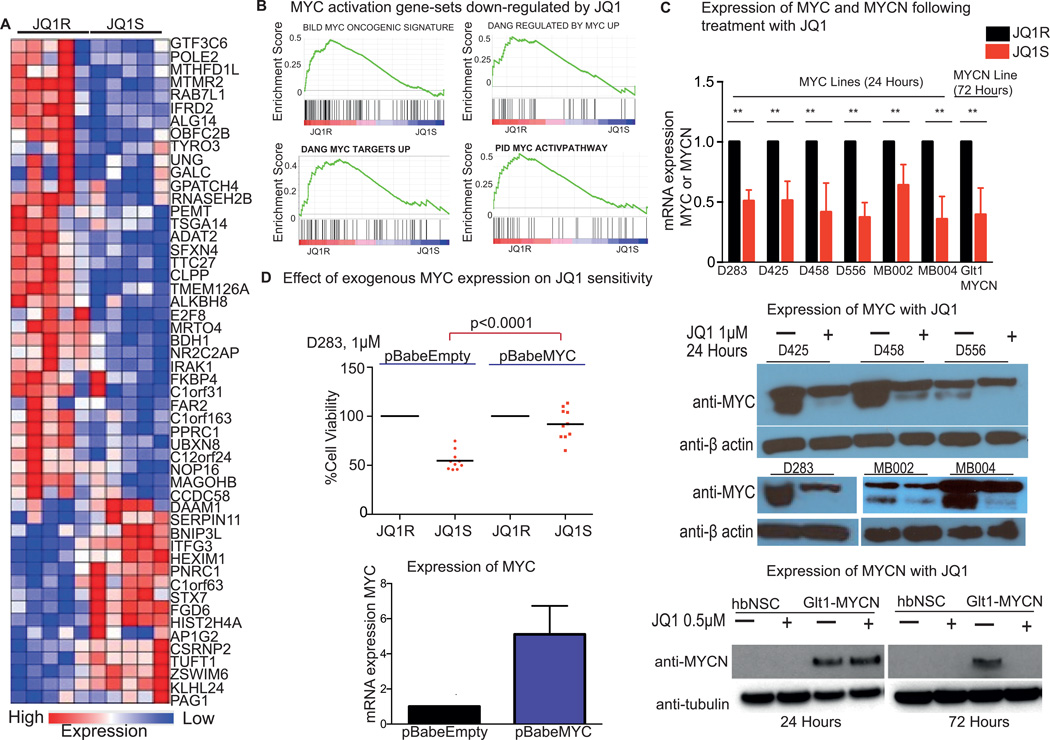
Purpose: MYC-amplified medulloblastomas are highly lethal tumors. Bromodomain and extraterminal (BET) bromodomain inhibition has recently been shown to suppress MYC-associated transcriptional activity in other cancers. The compound JQ1 inhibits BET bromodomain-containing proteins, including BRD4. Here, we investigate BET bromodomain targeting for the treatment of MYC-amplified medulloblastoma.

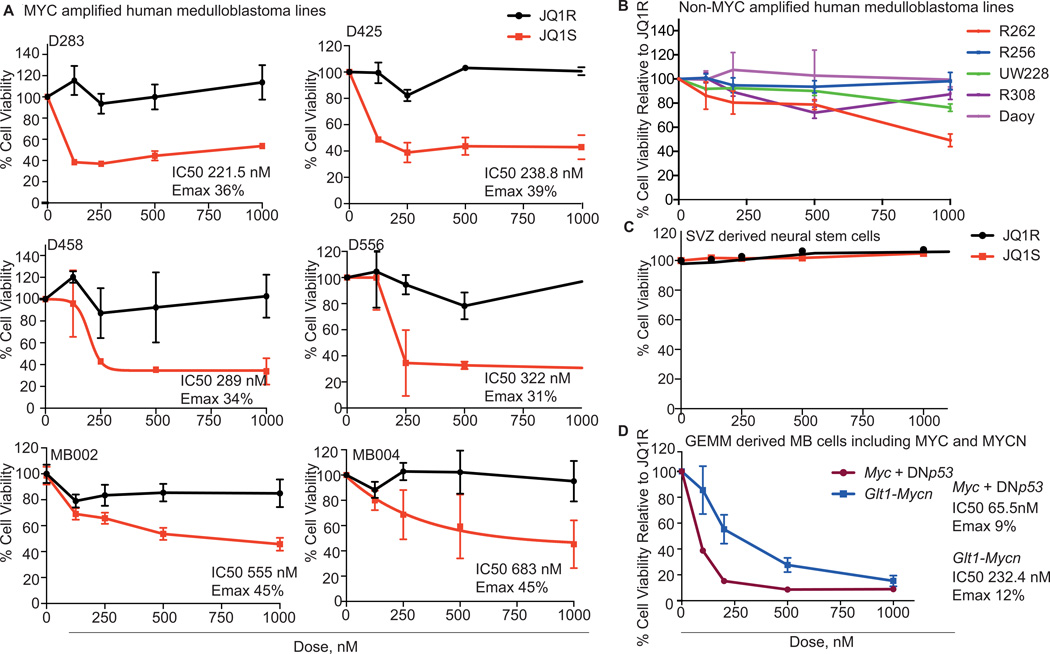
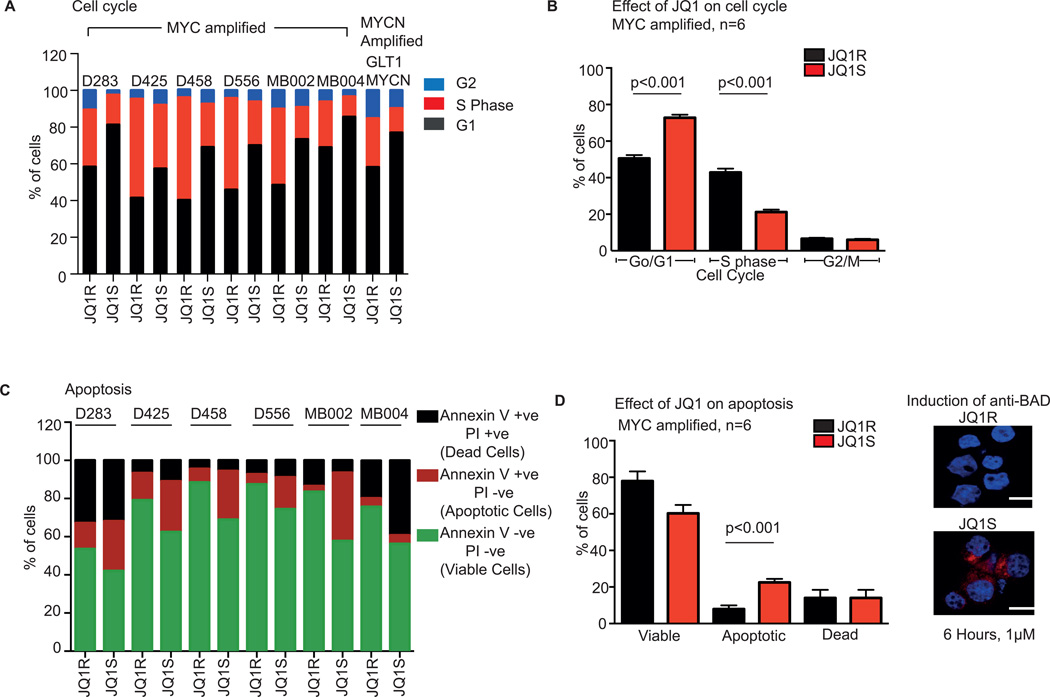
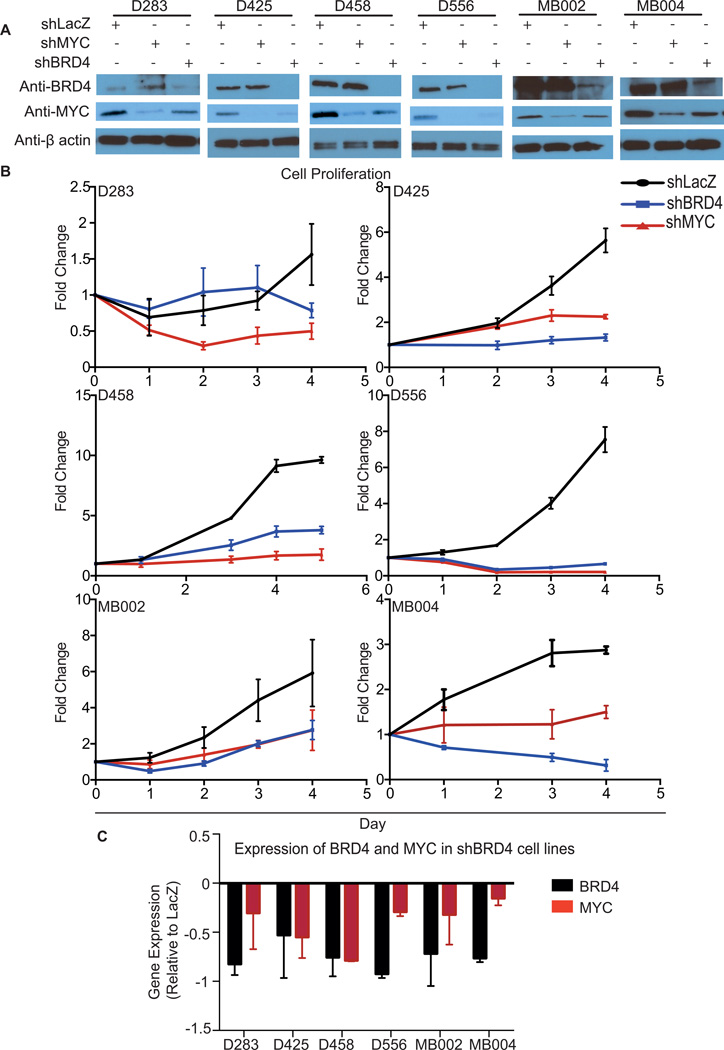
Experimental design: We evaluated the effects of genetic and pharmacologic inhibition of BET bromodomains on proliferation, cell cycle, and apoptosis in established and newly generated patient- and genetically engineered mouse model (GEMM)-derived medulloblastoma cell lines and xenografts that harbored amplifications of MYC or MYCN. We also assessed the effect of JQ1 on MYC expression and global MYC-associated transcriptional activity. We assessed the in vivo efficacy of JQ1 in orthotopic xenografts established in immunocompromised mice.

Results: Treatment of MYC-amplified medulloblastoma cells with JQ1 decreased cell viability associated with arrest at G1 and apoptosis. We observed downregulation of MYC expression and confirmed the inhibition of MYC-associated transcriptional targets. The exogenous expression of MYC from a retroviral promoter reduced the effect of JQ1 on cell viability, suggesting that attenuated levels of MYC contribute to the functional effects of JQ1. JQ1 significantly prolonged the survival of orthotopic xenograft models of MYC-amplified medulloblastoma (P < 0.001). Xenografts harvested from mice after five doses of JQ1 had reduced the expression of MYC mRNA and a reduced proliferative index.

Conclusion: JQ1 suppresses MYC expression and MYC-associated transcriptional activity in medulloblastomas, resulting in an overall decrease in medulloblastoma cell viability. These preclinical findings highlight the promise of BET bromodomain inhibitors as novel agents for MYC-amplified medulloblastoma.


Conflict of interest statement

Conflict of Interest: The Dana-Farber Cancer Institute has licensed drug-like derivatives of JQ1 prepared in the Bradner laboratory to Tensha Therapeutics for clinical translation as cancer therapeutics. Dana-Farber and Dr. Bradner have been provided minority equity shares in Tensha. Dr Qi has a consultant agreement with Tensha Therapeutics.

Figures

Figure 1
Figure 1. Amplifications of the MYC isoforms MYC, MYCN, or MYCL1 are common and mutually exclusive in medulloblastoma
A, Fractions of tumors in the Wnt, Sonic Hedgehog, Group 3 and Group 4 subtypes of medulloblastoma with amplifications of MYC, MYCN, or MYCL1 in 1071 medulloblastomas. B, Scatterplot (Left) depicting copy-numbers of different MYC isoforms in 1071 medulloblastoma samples. p value depicts significant anti-correlation between MYC and MYCN. Venn diagram (Right) showing medulloblastomas with high expression of MYC (z score >1), MYCN (z score >1.5) or MYCL1 (z score >0.85). p value depicts significant anti-correlation between MYC and MCYN. C, Correlation of MYC activation scores with copy-numbers of MYC isoforms (Left) and correlation of MYC activation scores with gene expression of MYC isoforms. p values depict significant differences in MYC activation scores. ANOVA p value <0.0001. D, Association between MYC activation and JQ1 consensus score (Left). p value depicts significant correlation as determined by Pearson’s Correlation test. Association between JQ1 consensus score and MYC amplifications (Right). p values depict significant differences in JQ1 scores. ANOVA p value <0.05.
Figure 2
Figure 2. JQ1 reduces cell proliferation in MYC-amplified medulloblastoma cell lines and murine models of MYC and MYCN amplified medulloblastoma
A, Dose-response curves of patient derived MYC-amplified medulloblastoma cell lines treated with JQ1S and JQ1R for 48 hours. % Cell viability is relative to untreated cells. Values shown represent mean ± SD. B, Dose-response curves of patient derived non MYC-amplified medulloblastoma cell lines treated with JQ1S for 72 hours. % Cell viability is relative to untreated cells. Values shown represent mean ± SD. C, Dose-response curves of neural stem cells derived from the subventricular zone treated with JQ1S and JQ1R. Values shown represent mean ± SD. D, Dose-response curves of cancer cells from genetically engineered mice models of Group 3 and 4 medulloblastoma with Myc or Mycn overexpression, after treatment with JQ1S. Values shown represent mean ± SD.
Figure 3
Figure 3. JQ1 induces G1 arrest and apoptosis in patient-derived MYC-amplified medulloblastoma cell lines
A Cell cycle analysis of MYC amplified patient medulloblastoma cell lines and one MYCN amplified cell line derived from a GEMM treated with 1µM of JQ1S and JQ1R for 72 hours B Pooled cell cycle analysis of MYC amplified medulloblastoma cell lines treated with 1µM of JQ1S and JQ1R for 72 hours. Values represent mean ± SD. ANOVA p value<0.001. C Annexin V/PI apoptosis assays of MYC amplified medulloblastoma cell lines treated with 1µM of JQ1S and JQ1R for 72 hours. Viable cells are negative for annexin V and PI, apoptotic cells are positive for Annexin V and negative for PI and dead cells are positive for both Annexin V and PI. D, Pooled Annexin V/PI apoptosis analysis of the six MYC-amplified medulloblastoma cell lines following treatment with 1µM of JQ1S and JQ1R for 72 hours. Values represent mean ± SD. Images on right shows induction of the apoptotic protein, BAD, in MB002 cell line, six hours following treatment with 1µM of JQ1S. Scale shown represents 20 micron.
Figure 4
Figure 4. Suppression of BRD4 in patient-derived MYC-amplified medulloblastoma cell lines suppresses proliferation and MYC expression
A, Immunoblots of BRD, MYC, and β-actin loading controls following infection with shRNAs targeting BRD4, MYC, or LacZ controls. B, Cell viability following infection with shRNAs targeting BRD4, MYC, or LacZ. Cell proliferation of MYC amplified medulloblastoma cell lines following suppression of BRD4, MYC or LacZ. Error bars represent the mean ± SD of 3 replicates per condition. C, BRD4 and MYC mRNA levels determined 72 hours after BRD4 suppression in the indicated cell lines. Values shown are the mean ± SD of 3 replicates per condition, normalized to expression in LacZ controls.
Figure 5
Figure 5. JQ1 treatment down-regulates transcription of MYC, MYCN and MYC activating pathways
A, Expression of genes in the JQ1 consensus signature in MYC-amplified medulloblastoma cell lines following 24-hour treatment with 1µM JQ1R or JQ1S. Red indicates increased gene expression and blue reduced gene expression. B, GSEA analysis of gene sets down-regulated among genes in medulloblastoma cell lines treated with JQ1S. C, Expression of MYC and MYCN mRNA and protein following treatment with JQ1R or JQ1S. MYC amplified cells were treated with 1µM of JQ1R or JQ1S for 24 hours and MYCN derived GEM lines were treated with 0.5 µM JQ1S over the indicated time course. mRNA expression values are normalized to housekeeping control and expression is depicted relative to JQ1R controls. Values shown represent mean ± SD of 3 replicates per condition. ** indicates p<0.05. Immunoblots for MYC and β-actin loading controls following 24-hour treatment with 1µM of JQ1S in the indicated cell lines or for MYCN and β-tubulin loading controls treated with 0.5 µM JQ1S over the indicated time course are shown. Lysates from hindbrain neural stems cells are shown as a negative control for MYCN expression. D, Cell viability of D283 infected with pBabeEmpty or pBabeMYC which were treated with 1µM of JQ1R or JQ1S six hours after infection. Cell viability is shown at 24 hours following treatment with JQ1R or JQ1S. Bars depict mean of ten replicates (individual values shown as scatterplot). qPCR for mRNA expression of MYC in D283 cells infected with retrovirus for pBabeEmpty or pBabeMYC is shown on the right. Expression is shown relative to β-actin controls, and normalized to expression for pBabeEmpty. Values depict mean ± SD of six replicates.
Figure 6
Figure 6. JQ1 prolongs survival of xenograft models of Group 3 medulloblastoma
A, Kaplan-Meier curves of mice with intracranial xenograft injections of MB002 treated with JQ1 or vehicle. B, Rate of tumor growth in NSG mice with orthotopic MB002 xenografts following treatment with JQ1 as monitored by bioilluminescence detection C, qPCR of MYC mRNA levels (normalized to β-actin) in cerebellar xenografts of MB002 following treatment with either vehicle control or JQ1. Values represent mean ± SD of six replicate measurements. D, Representative images of Ki67 staining of MB002 xenografts treated with vehicle control and JQ1 (Top panel). % Ki67 positivity in tumors from mice treated with either vehicle control (n=2) or JQ1(n=3). Values represent mean ± SD of three replicate measurements for each animal.

References

    1. Kieran MW, Walker D, Frappaz D, Prados M. Brain tumors: from childhood through adolescence into adulthood. J Clin Oncol. 2010;28:4783–4789. - PubMed
    1. Packer RJ, Gajjar A, Vezina G, Rorke-Adams L, Burger PC, Robertson PL, et al. Phase III study of craniospinal radiation therapy followed by adjuvant chemotherapy for newly diagnosed average-risk medulloblastoma. J Clin Oncol. 2006;24:4202–4208. - PubMed
    1. Mulhern RK, Palmer SL, Merchant TE, Wallace D, Kocak M, Brouwers P, et al. Neurocognitive consequences of risk-adapted therapy for childhood medulloblastoma. J Clin Oncol. 2005;23:5511–5519. - PubMed
    1. Packer RJ, Zhou T, Holmes E, Vezina G, Gajjar A. Survival and secondary tumors in children with medulloblastoma receiving radiotherapy and adjuvant chemotherapy: results of Children's Oncology Group trial A9961. Neuro Oncol. 2013;15:97–103. - PMC - PubMed
    1. Kool M, Korshunov A, Remke M, Jones DT, Schlanstein M, Northcott PA, et al. Molecular subgroups of medulloblastoma: an international meta-analysis of transcriptome, genetic aberrations, and clinical data of WNT, SHH, Group 3, and Group 4 medulloblastomas. Acta Neuropathol. 2012;123:473–484. - PMC - PubMed

Publication types

MeSH terms