

A maximum entropy framework for nonexponential distributions
- PMID: 24297895
- PMCID: PMC3870711
- DOI: 10.1073/pnas.1320578110
A maximum entropy framework for nonexponential distributions
Abstract
Probability distributions having power-law tails are observed in a broad range of social, economic, and biological systems. We describe here a potentially useful common framework. We derive distribution functions for situations in which a "joiner particle" k pays some form of price to enter a community of size , where costs are subject to economies of scale. Maximizing the Boltzmann-Gibbs-Shannon entropy subject to this energy-like constraint predicts a distribution having a power-law tail; it reduces to the Boltzmann distribution in the absence of economies of scale. We show that the predicted function gives excellent fits to 13 different distribution functions, ranging from friendship links in social networks, to protein-protein interactions, to the severity of terrorist attacks. This approach may give useful insights into when to expect power-law distributions in the natural and social sciences.
Keywords: fat tail; heavy tail; social physics; statistical mechanics; thermostatistics.
Conflict of interest statement
The authors declare no conflict of interest.
Figures
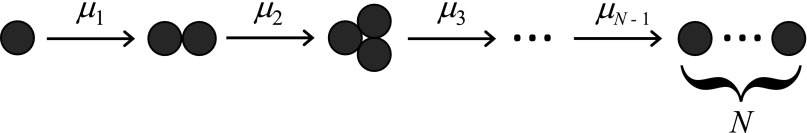
 community is
  . This diagram can describe particles forming colloidal clusters, or social processes such as people joining cities, citations added to papers, or link creation in a social network.
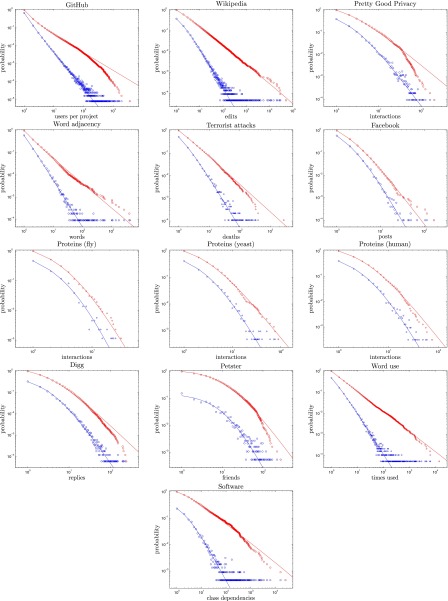
 ; see
; see  and
and  given in Table 1. Points are empirical data, and lines represent best-fit distributions. The probability
  of exactly k is shown in blue, and the probability of at least k (the complementary cumulative distribution,
  ) is shown in red. Descriptions and references for these datasets can be found in
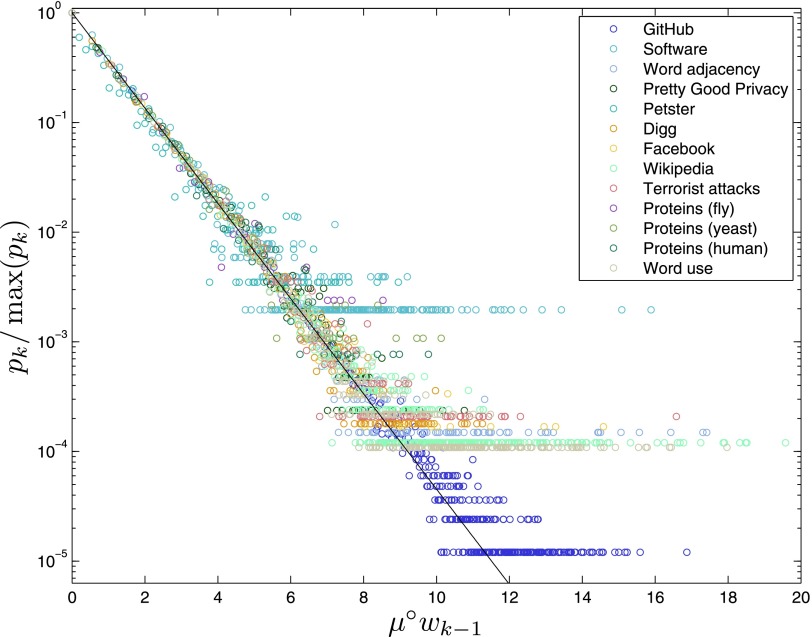
 . Values of
  and
and  are shown in Table 1. The y axis has been rescaled by dividing by the maximum
  , so that all curves begin at
  . All data sets are fit by the
  line. See Fig. 2 for fits to individual datasets.
References
-
- Mantegna R, Stanley H. Scaling behaviour in the dynamics of an economic index. Nature. 1995;376:46–49.
-
- Zipf GK. Human Behavior and the Principle of Least Effort. Cambridge, MA: Addison-Wesley; 1949.
-
- Broder A, et al. Graph structure in the web. Comput Netw. 2000;33(1-6):309–320.
-
- Newman M. Power laws, Pareto distributions and Zipf’s law. Contemp Phys. 2005;46(5):323–351.
-
- Clauset A, Shalizi C, Newman M. Power-law distributions in empirical data. SIAM Rev. 2009;51(4):661–703.
Publication types
LinkOut - more resources
Full Text Sources
Other Literature Sources
