Qualitatively different T cell phenotypic responses to IL-2 versus IL-15 are unified by identical dependences on receptor signal strength and duration
- PMID: 24298013
- PMCID: PMC3950894
- DOI: 10.4049/jimmunol.1302291
Qualitatively different T cell phenotypic responses to IL-2 versus IL-15 are unified by identical dependences on receptor signal strength and duration
Abstract
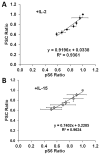
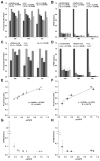
IL-2 and IL-15 are common γ-chain family cytokines involved in regulation of T cell differentiation and homeostasis. Despite signaling through the same receptors, IL-2 and IL-15 have non-redundant roles in T cell biology, both physiologically and at the cellular level. The mechanisms by which IL-2 and IL-15 trigger distinct phenotypes in T cells remain elusive. To elucidate these mechanisms, we performed a quantitative comparison of the phosphotyrosine signaling network and resulting phenotypes triggered by IL-2 and IL-15. This study revealed that the signaling networks activated by IL-2 or IL-15 are highly similar and that T cell proliferation and metabolism are controlled in a quantitatively distinct manner through IL-2/15R signal strength independent of the cytokine identity. Distinct phenotypes associated with IL-2 or IL-15 stimulation therefore arise through differential regulation of IL-2/15R signal strength and duration because of differences in cytokine-receptor binding affinity, receptor expression levels, physiological cytokine levels, and cytokine-receptor intracellular trafficking kinetics. These results provide important insights into the function of other shared cytokine and growth factor receptors, quantitative regulation of cell proliferation and metabolism through signal transduction, and improved design of cytokine based clinical immunomodulatory therapies for cancer and infectious diseases.
Figures



Similar articles
-
Staphylococcus enterotoxin A modulates interleukin 15-induced signaling and mitogenesis in human T cells.Tissue Antigens. 1998 Feb;51(2):164-73. doi: 10.1111/j.1399-0039.1998.tb02961.x. Tissue Antigens. 1998. PMID: 9510372
-
Characterization of Receptor-Associated Protein Complex Assembly in Interleukin (IL)-2- and IL-15-Activated T-Cell Lines.J Proteome Res. 2017 Jan 6;16(1):106-121. doi: 10.1021/acs.jproteome.6b00233. Epub 2016 Aug 18. J Proteome Res. 2017. PMID: 27463037
-
Signaling T-cell survival and death by IL-2 and IL-15.Am J Transplant. 2005 Nov;5(11):2623-31. doi: 10.1111/j.1600-6143.2005.01075.x. Am J Transplant. 2005. PMID: 16212621
-
Cytokines: shared receptors, distinct functions.Curr Biol. 1997 Jul 1;7(7):R424-6. doi: 10.1016/s0960-9822(06)00208-9. Curr Biol. 1997. PMID: 9210372 Review.
-
[Contribution of interleukin 2 and interleukin 12 receptors in signal transduction during cell activation of the immune system].Postepy Hig Med Dosw. 2002;56(6):707-31. Postepy Hig Med Dosw. 2002. PMID: 12661403 Review. Polish.
Cited by
-
Phosphorylation at tyrosine 317 and 508 are crucial for PIK3CA/p110α to promote CRC tumorigenesis.Cell Biosci. 2023 Sep 9;13(1):164. doi: 10.1186/s13578-023-01102-7. Cell Biosci. 2023. PMID: 37689735 Free PMC article.
-
IL-15 activates mTOR and primes stress-activated gene expression leading to prolonged antitumor capacity of NK cells.Blood. 2016 Sep 15;128(11):1475-89. doi: 10.1182/blood-2016-02-698027. Epub 2016 Jul 27. Blood. 2016. PMID: 27465917 Free PMC article.
-
Demystifying the cytokine network: Mathematical models point the way.Cytokine. 2017 Oct;98:115-123. doi: 10.1016/j.cyto.2016.11.013. Epub 2016 Dec 3. Cytokine. 2017. PMID: 27919524 Free PMC article. Review.
-
Modeling simian immunodeficiency virus (SIV) latency in primary rhesus macaque CD4+ T cells.bioRxiv [Preprint]. 2025 Jul 28:2025.04.22.650029. doi: 10.1101/2025.04.22.650029. bioRxiv. 2025. PMID: 40766556 Free PMC article. Preprint.
-
Mechanistic Insights into CpG DNA and IL-15 Synergy in Promoting B Cell Chronic Lymphocytic Leukemia Clonal Expansion.J Immunol. 2018 Sep 1;201(5):1570-1585. doi: 10.4049/jimmunol.1800591. Epub 2018 Aug 1. J Immunol. 2018. PMID: 30068596 Free PMC article.
References
-
- Burton JD, Bamford RN, Peters C, Grant AJ, Kurys G, Goldman CK, Brennan J, Roessler E, Waldmann TA. A lymphokine, provisionally designated interleukin T and produced by a human adult T-cell leukemia line, stimulates T-cell proliferation and the induction of lymphokine-activated killer cells. Proc Natl Acad Sci U S A. 1994;91:4935–4939. - PMC - PubMed
-
- Cantrell DA, Smith KA. The interleukin-2 T-cell system: a new cell growth model. Science. 1984;224:1312–1316. - PubMed
-
- Fehniger TA, Cooper MA, Caligiuri MA. Interleukin-2 and interleukin-15: immunotherapy for cancer. Cytokine Growth Factor Rev. 2002;13:169–183. - PubMed
-
- Waldmann TA. The biology of interleukin-2 and interleukin-15: implications for cancer therapy and vaccine design. Nat Rev Immunol. 2006;6:595–601. - PubMed
-
- Waldmann TA, Conlon KC, Stewart DM, Worthy TA, Janik JE, Fleisher TA, Albert PS, Figg WD, Spencer SD, Raffeld M, Decker JR, Goldman CK, Bryant BR, Petrus MN, Creekmore SP, Morris JC. Phase 1 trial of IL-15 trans presentation blockade using humanized Mikβ1 mAb in patients with T-cell large granular lymphocytic leukemia. Blood. 2013;121:476–484. - PMC - PubMed
Publication types
MeSH terms
Substances
Grants and funding
LinkOut - more resources
Full Text Sources
Other Literature Sources
Molecular Biology Databases

