. 2013 Dec 1;27(23):2576-89.
doi: 10.1101/gad.224089.113.

Ephrin-B2 controls PDGFRβ internalization and signaling

Affiliations

Ephrin-B2 controls PDGFRβ internalization and signaling

Akiko Nakayama et al. Genes Dev. .

Erratum in

Abstract

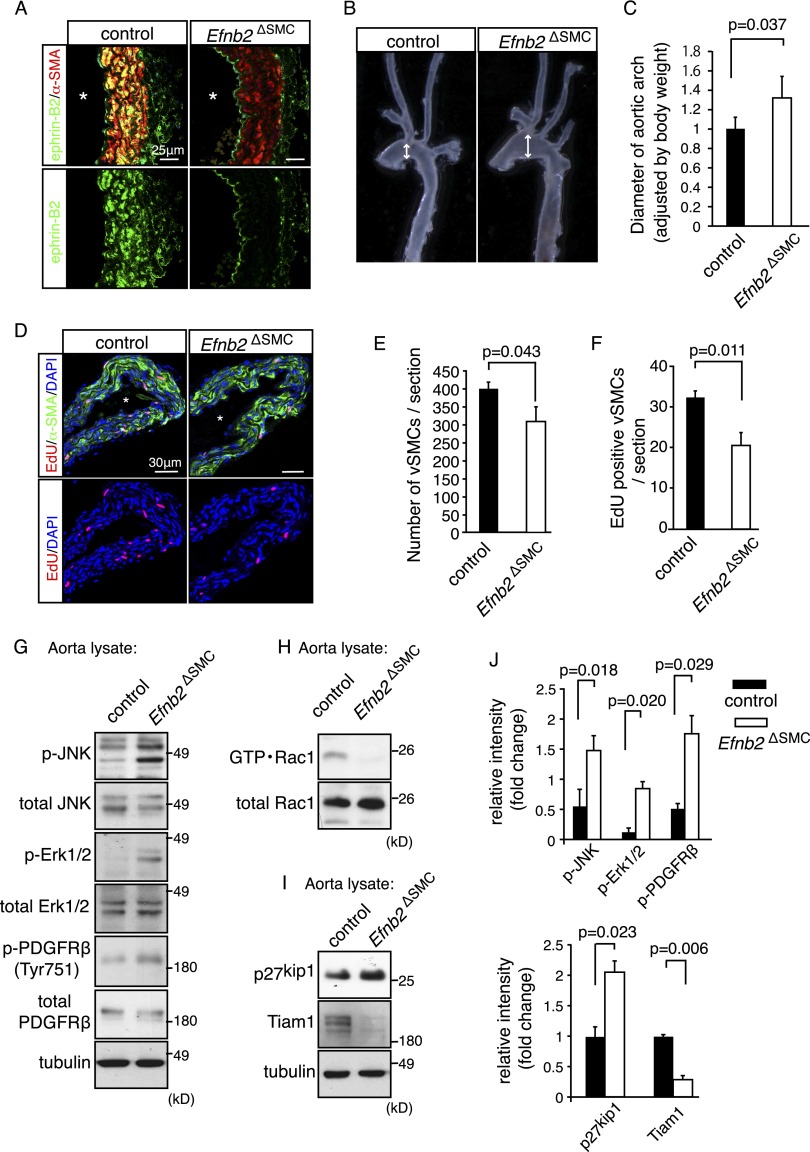
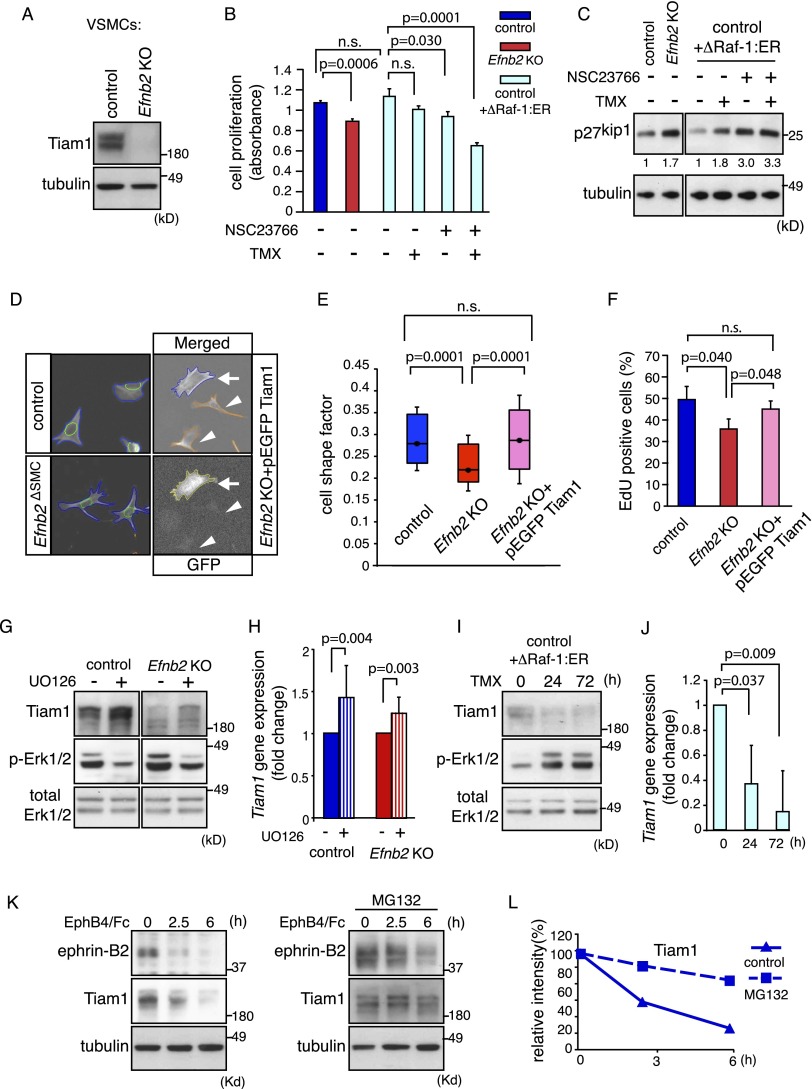
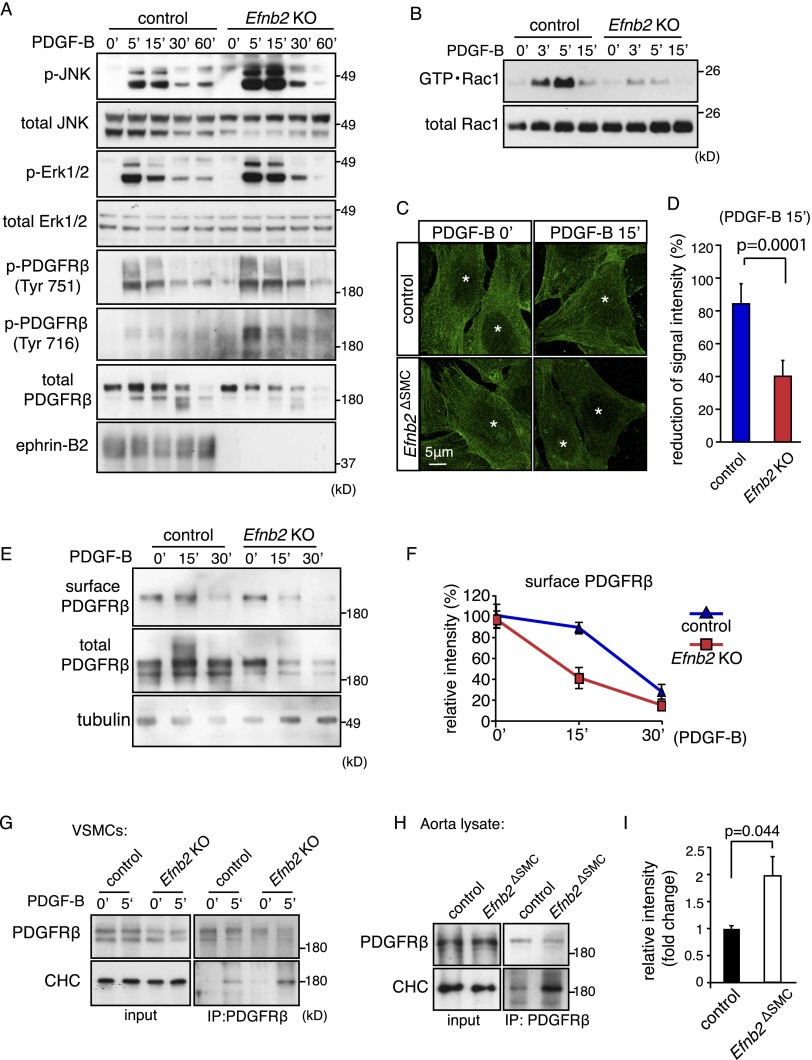
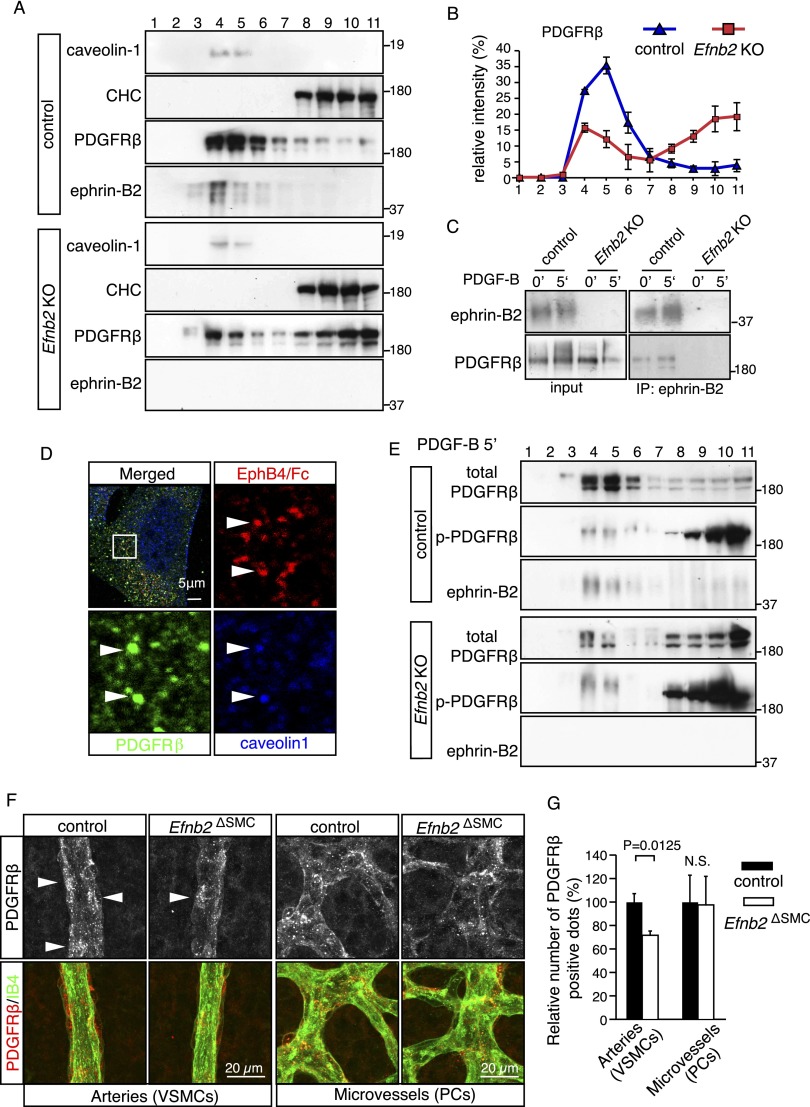
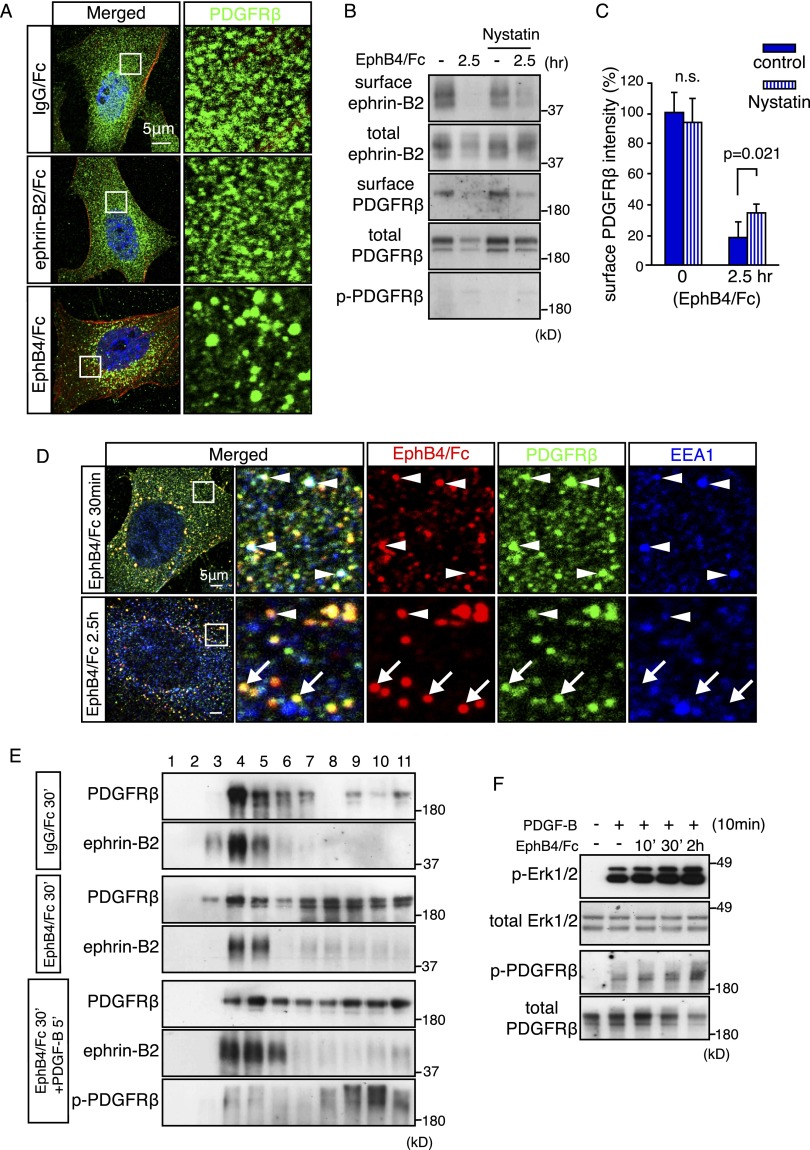
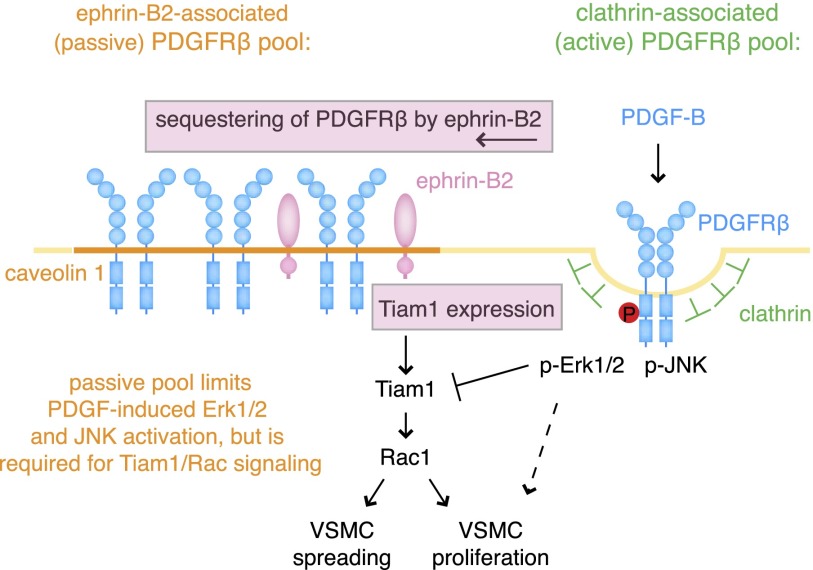
B-class ephrins, ligands for EphB receptor tyrosine kinases, are critical regulators of growth and patterning processes in many organs and species. In the endothelium of the developing vasculature, ephrin-B2 controls endothelial sprouting and proliferation, which has been linked to vascular endothelial growth factor (VEGF) receptor endocytosis and signaling. Ephrin-B2 also has essential roles in supporting mural cells (namely, pericytes and vascular smooth muscle cells [VSMCs]), but the underlying mechanism is not understood. Here, we show that ephrin-B2 controls platelet-derived growth factor receptor β (PDGFRβ) distribution in the VSMC plasma membrane, endocytosis, and signaling in a fashion that is highly distinct from its role in the endothelium. Absence of ephrin-B2 in cultured VSMCs led to the redistribution of PDGFRβ from caveolin-positive to clathrin-associated membrane fractions, enhanced PDGF-B-induced PDGFRβ internalization, and augmented downstream mitogen-activated protein (MAP) kinase and c-Jun N-terminal kinase (JNK) activation but impaired Tiam1-Rac1 signaling and proliferation. Accordingly, mutant mice lacking ephrin-B2 expression in vascular smooth muscle developed vessel wall defects and aortic aneurysms, which were associated with impaired Tiam1 expression and excessive activation of MAP kinase and JNK. Our results establish that ephrin-B2 is an important regulator of PDGFRβ endocytosis and thereby acts as a molecular switch controlling the downstream signaling activity of this receptor in mural cells.

Keywords: PDGF; receptor; signaling; tyrosine kinase.


Figures

Figure 1.
Figure 1.
Vessel wall defects in smooth muscle cell-specific ephrin-B2 mutants. (A) Confocal images showing ephrin-B2 (green) and α-smooth muscle actin (α-SMA; red) immunostaining on sections of adult (30 wk) control and Efnb2ΔSMC mutant aortae. (*) Vessel lumen. (B) Dilation affecting freshly isolated adult Efnb2ΔSMC aortic arches (right) compared with control littermates (left). Arrows indicate vessel diameter. (C) Quantitation of relative aortic arch diameter of adult mice (>30 wk). P-value was calculated using two-tailed Student's t-test (n = 4). Error bars indicate SD. (DF) 5-Ethynyl-2′-deoxyuridine (EdU) labeling (2-h pulse; red) of proliferating cells in control and mutant P8 aorta. (Green) α-SMA; (blue) nuclei (DAPI). (*) Vessel lumen. Quantitation of total α-SMA-positive cells (E) and EdU-labeled VSMCs (F). P-values were calculated using two-tailed Student's t-test (n = 3). Error bars indicate SD. (G) Western blot analysis of total and phosphorylated JNK (p-JNK), Erk1/2 (p-Erk1/2), and PDGFRβ (p-PDFGRβ) in control and Efnb2ΔSMC aorta lysate, as indicated. Tubulin is shown as a loading control. Molecular weight markers (in kilodaltons) are indicated. (H,I) Strongly decreased levels of active Rac1 (GTP·Rac1) in Efnb2ΔSMC aorta lysate relative to control (shown in H). (I) Tiam1 protein was nearly undetectable in mutant samples, whereas amounts of p27kip1 were elevated. Tubulin is shown as a loading control. Molecular weight markers are indicated. (J) Quantitative analysis of band intensities in the Western blots shown in H and I and replicates. P-values were calculated using two-tailed Student's t-test (n = 3). Error bars indicate SD.
Figure 2.
Figure 2.
Regulation of VSMC proliferation by Tiam1–Rac1 and MAP kinase. (A) Western blot showing strongly decreased Tiam1 protein levels in Efnb2 knockout VSMCs. Tubulin is shown as a loading control. Molecular weight markers are indicated. (B) Cell proliferation (measured by the detection of cleaved tetrazolium salts) was reduced by Rac1 inhibitor (NSC23766) as well as simultaneous up-regulation of Erk1/2 activity (ΔRaf1:ER+tamoxifen [TMX]). P-values were calculated using ANOVA with Tukey's post-hoc test (n = 3). Error bars indicate SD. (C) Levels of the cell cycle inhibitor p27kip1 were increased by Rac1 inhibition and were not restored by Erk1/2 activation (ΔRaf1:ER+TMX) in cultured murine VSMCs. Tubulin is shown as a loading control. Densiometric readings for p27kip1 bands and molecular weight markers (in kilodaltons) are indicated. (D) Images of automatic cell shape analysis. Phalloidin-stained VSMCs (blue) and DAPI-stained nuclei (green) were segmented. Arrows mark Efnb2 knockout cells that express pEGFP-Tiam1 (yellow); arrowheads in the images at the right indicate rejected cells due to undetectable GFP expression. (E) Box-and-whiskers diagram of shape factor data of D. A dot marks the median, the box spans 30% of the values, and whiskers span 50% of the values. P-values were calculated using ANOVA and Tukey's post-hoc test (control, n = 263; knockout [KO], n = 263; KO+pEGFP Tiam1, n = 232). Smaller shape factor of Efnb2 cells was rescued by re-expression of Tiam1. (F) Re-expression of Tiam1 restored cell proliferation defects (measured by 2 h of EdU incorporation) in Efnb2 knockout smooth muscle cells. P-values were calculated using ANOVA (n = 3). Error bars indicate SD. (G) Western blot showing increased Tiam1 protein after Erk1/2 inhibition (U0126) for 24 h. Total Erk1/2 and p-Erk1/2 bands, which were strongly reduced by U0126, are shown below. (H) Quantitative PCR (qPCR) of Tiam1 expression in control or Efnb2 knockout VSMCs incubated with U0126 for 24 h. P-values were calculated using two-tailed Student's t-test (n = 3). Error bars indicate SD. (I,J) Western blot (I) and qPCR results (J) showing reduced Tiam1 levels after Erk1/2 activation (ΔRaf1:ER+TMX) for the indicated times. P-values were calculated using two-tailed Student's t-test (n = 3). Error bars indicate SD. (K) Tiam1 and ephrin-B2 protein levels were decreased after stimulation of VSMCs with EphB4/Fc for the indicated times (left), which was strongly reduced after administration of MG132 (right). (L) Densiometric analysis of data shown in K.
Figure 3.
Figure 3.
Ephrin-B2 negatively regulates PDGFRβ signaling and internalization. (A) Western blot showing increased activation of JNK, Erk1/2, and PDGFRβ in PDGF-B-stimulated Efnb2 knockout compared with control VSMCs. (Bottom) Ephrin-B2 bands were absent in knockout cells. Molecular weight markers (in kilodaltons) are indicated at the right. (B) PDGF-B-induced activation of Rac1 (GTP • Rac1) was strongly diminished in Efnb2-deficient VSMCs. Time points after stimulation and molecular weight markers are indicated. Total Rac1 is shown as a loading control. (C) Immunofluorescence on cultured VSMCs showing accelerated removal of cell surface PDGFRβ (green; nonpermeabilized cells) in Efnb2 knockout cells at 15 min (15′) after PDGF-B stimulation. (*) Nuclei. (D) Statistical analysis of surface PDGFRβ signals shown in C. P-values were calculated using two-tailed Student's t-test (n = 5). Error bars indicate SD. (E,F) Biochemical detection of surface (biotinylated) and total PDGFRβ in PDGF-B-stimulated control and Efnb2 knockout VSMCs (E) and quantitation of band intensities (normalized to 0′) (F). (G) Western blot showing enhanced coimmunoprecipitation of CHC with PDGFRβ at 5 min after PDGF-B stimulation in cultured murine Efnb2 knockout and control cells. (H,I) Western blot showing enhanced coimmunoprecipitation of CHC with PDGFRβ from Efnb2ΔSMC aorta lysate relative to control (shown in H). Input is shown at the left, and molecular weight markers (in kilodaltons) are indicated at the right. (I) Densiometric analysis of immunoprecipitated CHC. P-values were calculated using two-tailed Student's t-test (n = 3). Error bars indicate SD.
Figure 4.
Figure 4.
PDGFRβ membrane distribution depends on ephrin-B2. (A,B) Sucrose density gradient centrifugation of membrane fractions from control and Efnb2 knockout cells (fractions 1–11, top to bottom of gradient). (A) Note redistribution of PDGFRβ from caveolin-1-positive into CHC-containing fractions in Efnb2 knockout VSMCs. (B) Quantitation of PDGFRβ signals in fractions 1–11 (densiometric readings). Error bars indicate SD. (C) Coimmunoprecipitation of PDGFRβ with ephrin-B2 (in sucrose gradient fractions 3–6) was enhanced after stimulation with PDGF-B (5′) from control but not Efnb2 knockout cells. (D) Immunofluorescence of ephrin-B2 (detected by EphB4/Fc; red), PDGFRβ (green), and caveolin-1 (blue). Individual channels of the insets are shown below the top panels. Arrowheads indicate colocalization of ephrin-B2, PDGFRβ, and caveolin-1. (E) Sucrose density gradient fractionation of PDGF-B-stimulated control and Efnb2 knockout VSMCs. Note the predominant distribution of p-PDGFRβ bands in fractions 8–11, which was enhanced in the absence of ephrin-B2, whereas weak phosphorylation was associated with the bulk of PDGFRβ in fractions 4–6. (F,G) The PDGFRβ immunosignal in VSMCs surrounding P8 retinal arteries is reduced in Efnb2ΔSMC mutants relative to littermate controls, whereas comparable signals were seen in capillary perivascular cells (shown in F), which are not targeted by SM22α-Cre transgenics. (G) Quantitation of PDGFRβ immunosignals. P-values were calculated using two-tailed Student's t-test (n = 3). Error bars indicate SD.
Figure 5.
Figure 5.
Eph–ephrin binding triggers PDGFRβ internalization. (A) Indirect immunofluorescence of PDGFRβ (green) in cultured murine VSMCs stimulated with IgG/Fc, ephrin-B2/Fc, or EphB4/Fc for 2 h, as indicated. (Red) Actin (phalloidin); (blue) nuclei (DAPI). Note accumulation of PDGFRβ in perinuclear structures resembling vesicles after EphB4/Fc but not ephrin-B2/Fc treatment. The panels at the right show higher magnification of the insets. (B) Western blot showing reduction of biotinylated (surface) ephrin-B2 and PDGFRβ in cultured murine VSMCs treated with EphB4/Fc. Nystatin treatment had a mild effect on EphB4/Fc-induced PDGFRβ and ephrin-B2 internalization. (C) Densiometric analysis of biotinylated (surface) PDGFRβ shown in B. P-values were calculated using two-tailed Student's t-test (n = 3). Error bars indicate SD. (D) Immunofluorescence of ephrin-B2 (detected by EphB4/Fc binding; red), PDGFRβ (green), and EEA1 (blue) in murine VSMCs at 0.5 and 2.5 h after EphB4/Fc treatment. Higher magnifications of the insets in the left images are shown in the other panels. Arrowheads indicate colocalization (white) of ephrin-B2, PDGFRβ, and EEA1 in early endosomes; arrows mark ephrin-B2+ and PDGFRβ+ but EEA1 structures. (E) Sucrose density gradient centrifugation of VSCMs at 30 min after stimulation with IgG/Fc, EphB4/Fc, or EphB4/Fc+PDFG-B, as indicated. EphB4/Fc triggered redistribution of PDGFRβ from fractions 4–7 into fractions 8–11. Active PDGFRβ (P-PDGFRβ) at 5 min after stimulation with PDGF-B was associated with fractions 8–11. Molecular weight markers (in kilodaltons) are indicated. (F) Western blot showing that Erk1/2 and PDGFRβ phosphorylation in PDGF-B-stimulated VSMCs (10 min) was enhanced by pretreatment with EphB4/Fc for the indicated times. Total Erk1/2 and PDGFRβ levels and molecular weight markers (in kilodaltons) are shown. Statistical analysis of p-Erk1/2 is provided in Supplemental Fig. 5C.
Figure 6.
Figure 6.
Schematic summary of findings. Ephrin-B2 sequesters PDGFRβ into caveolin-1-positive membrane domains and thereby counteracts clathrin-mediated endocytosis and excessive activation of the RTK. In particular, this process limits PDGF-B-induced Erk1/2 and JNK activation. Accordingly, down-regulation of ephrin-B2 levels (for example, via EphB-induced internalization through interactions with other VSMCs) enhances Erk1/2 and JNK signaling in response to PDGF-B. At the same time, ephrin-B2 positively regulates Tiam1 expression and thereby PDGF-B-induced Rac1 activation. MAP kinase overactivation reduces Tiam1 transcript levels and protein, which leads to impaired smooth muscle cell spreading and proliferation.

References

    1. Abella JV, Park M 2009. Breakdown of endocytosis in the oncogenic activation of receptor tyrosine kinases. Am J Physiol Endocrinol Metab 296: E973–E984 - PubMed
    1. Andrae J, Gallini R, Betsholtz C 2008. Role of platelet-derived growth factors in physiology and medicine. Genes Dev 22: 1276–1312 - PMC - PubMed
    1. Batlle E, Henderson JT, Beghtel H, van den Born MM, Sancho E, Huls G, Meeldijk J, Robertson J, van de Wetering M, Pawson T, et al. 2002. β-Catenin and TCF mediate cell positioning in the intestinal epithelium by controlling the expression of EphB/ephrinB. Cell 111: 251–263 - PubMed
    1. Bethani I, Skanland SS, Dikic I, Acker-Palmer A 2010. Spatial organization of transmembrane receptor signalling. EMBO J 29: 2677–2688 - PMC - PubMed
    1. Bond M, Wu YJ, Sala-Newby GB, Newby AC 2008. Rho GTPase, Rac1, regulates Skp2 levels, vascular smooth muscle cell proliferation, and intima formation in vitro and in vivo. Cardiovasc Res 80: 290–298 - PubMed

Publication types

Substances

LinkOut - more resources