. 2014 Jan;24(1):117-24.
doi: 10.1101/gr.157792.113. Epub 2013 Dec 2.

Independent RNA polymerase II preinitiation complex dynamics and nucleosome turnover at promoter sites in vivo

Affiliations

Independent RNA polymerase II preinitiation complex dynamics and nucleosome turnover at promoter sites in vivo

Yoselin Grimaldi et al. Genome Res. 2014 Jan.

Abstract

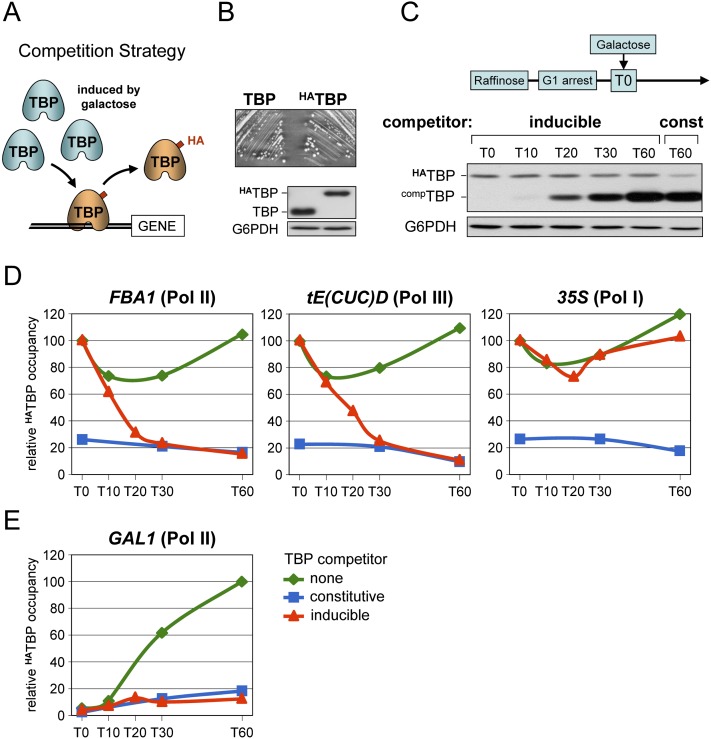
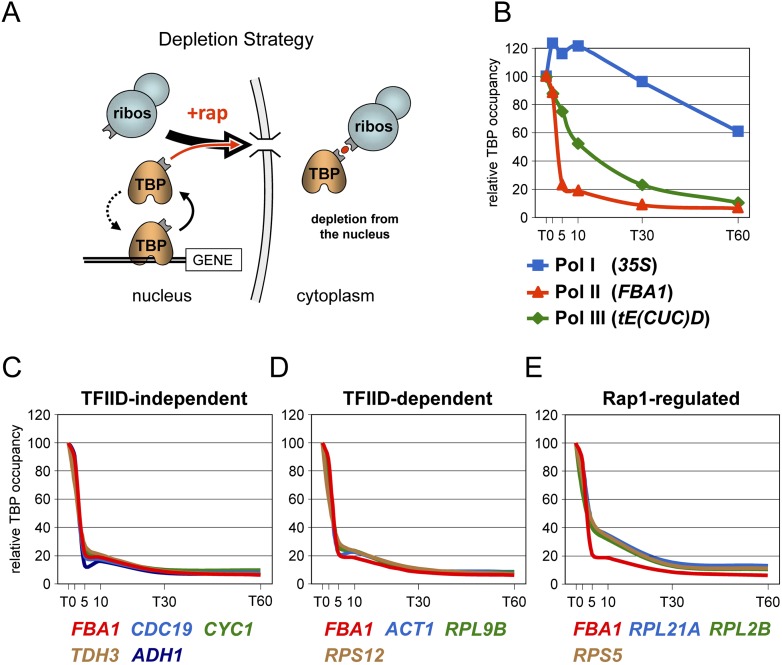
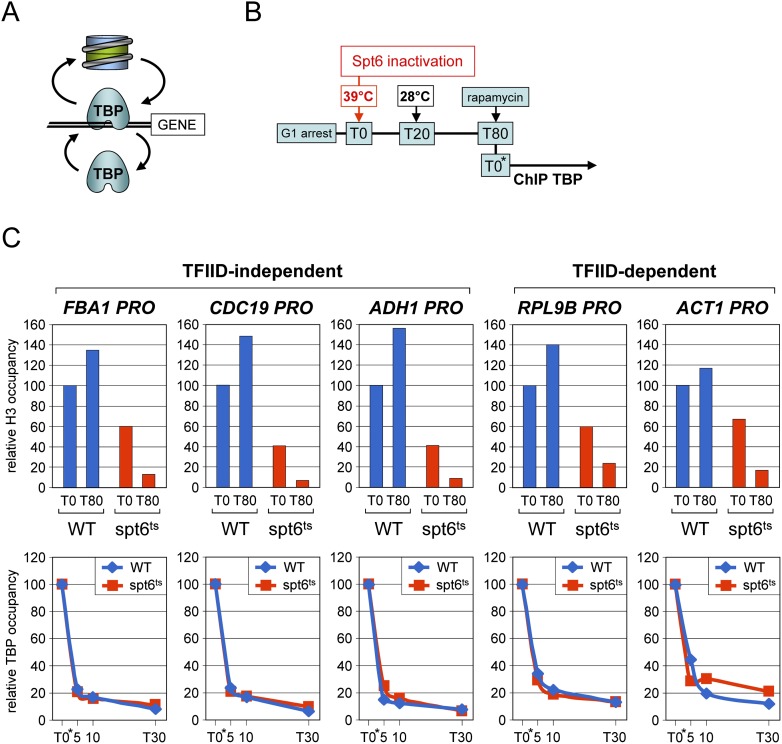
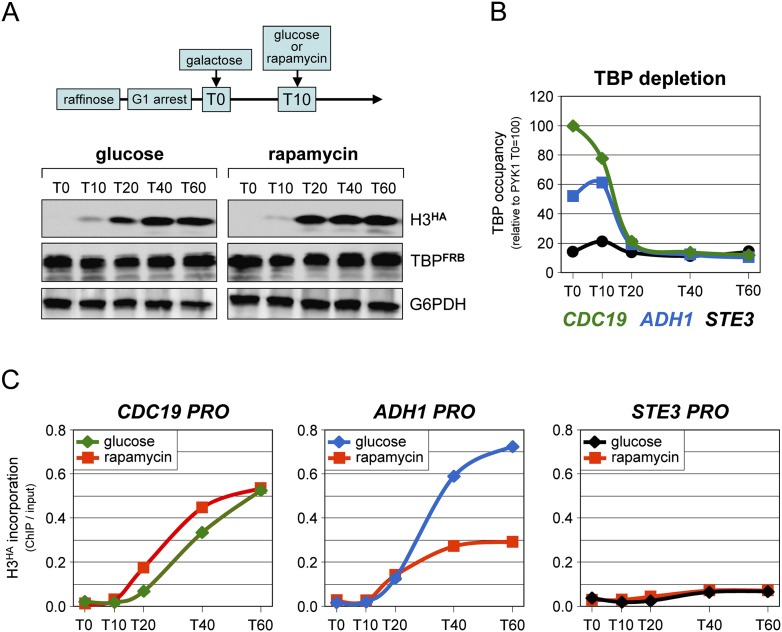
Transcription by all three eukaryotic RNA polymerases involves the assembly of a large preinitiation complex (PIC) at gene promoters. The PIC comprises several general transcription factors (GTFs), including TBP, and the respective RNA polymerase. It has been suggested that some GTFs remain stably bound at active promoters to facilitate multiple transcription events. Here we used two complementary approaches to show that, in G1-arrested yeast cells, TBP exchanges very rapidly even at the most highly active RNA Pol II promoters. A similar situation is observed at RNA Pol III promoters. In contrast, TBP remains stably bound at RNA Pol I promoters. We also provide evidence that, unexpectedly, PIC dynamics are neither the cause nor the consequence of nucleosome exchange at most of the RNA Pol II promoters we analyzed. These results point to a stable reinitiation complex at RNA Pol I promoters and suggest independent PIC and nucleosome turnover at many RNA Pol II promoters.


Figures

Figure 1.
Figure 1.
A ChIP-based competition assay reveals high TBP turnover at RNA Pol II and Pol III promoters and stable binding at RNA Pol I promoters. See also Supplemental Figure S1 for additional promoters and Supplemental Figure S9 for biological replicates. (A) Schematic diagram of the competition approach. See text for details. (B) The starting yeast strain expressing an HA-tagged TBP (HATBP) from its native locus and its isogenic wild-type counterpart (TBP) were examined for growth on YPD plates. TBP protein levels were monitored by Western blot analysis using anti-TBP antibodies and anti-G6PDH antibodies as a loading control. (C) Cells expressing HATBP and a plasmid-encoded native TBP competitor (compTBP) from the galactose-inducible GAL1 promoter were grown overnight in raffinose and arrested in G1 by treatment with alpha factor. Expression of native TBP was then induced by directly adding galactose to the medium. Culture aliquots were removed just prior to (T0) and at the indicated time points (in minutes) after galactose addition, and directly processed for Western blot and ChIP analyses (D,E). HATBP and TBP protein levels in whole cell extracts prepared before cross-linking were evaluated using anti-TBP antibodies. G6PDH served as a loading control. The last sample on the right is from cells constitutively expressing TBP (const) from the DED1 promoter. Note that HATBP expression remains constant throughout the experiment. (D) The levels of HATBP occupancy at the indicated promoters and time points (in minutes) were measured by quantitative ChIP analysis using anti-HA antibodies. The strains were treated in parallel as in C and express the TBP competitor from the galactose-inducible GAL1 promoter (inducible), the constitutively active DED1 promoter (constitutive), or no TBP competitor (none). The ChIP signals are relative to those measured at T0 in each strain. These were set to a value of 100, except for the constitutively expressing TBP strain for which the T0 value is relative to the signal detected in the strain expressing no TBP competitor. (E) Same as in D but showing HATBP occupancy at the galactose-induced GAL1 promoter. The ChIP signals are expressed relative to those measured at T60 (=100) in the strain with no TBP competitor (none). Note that the slight increase in HATBP occupancy at T20 following galactose induction of TBP was not observed in an independent experiment (Supplemental Fig. S9).
Figure 2.
Figure 2.
TBP residence time at RNA Pol I, Pol II, and Pol III promoters as measured by the anchor-away assay. See also Supplemental Figures S4 and S5. (A) Schematic diagram of the TBP anchor-away approach (Haruki et al. 2008). Upon addition of rapamycin (+rap, red dot), TBP fused to the rapamycin-binding domain FRB is exported out of the nucleus by the flow of ribosomal subunits (ribos) through its interaction with a ribosomal protein bearing the complementary FKBP rapamycin-binding domain (for details, see Haruki et al. 2008). (B) FRB-tagged TBP occupancy at the indicated promoters was measured just before and at the indicated time points after rapamycin addition by quantitative ChIP using anti-TBP antibodies. Note that the experiment includes a 2-min time point. Because TBP occupancy varies among promoters, results are expressed relative to the T0 value, which was taken as 100, to allow for direct comparison. (C) Same as in B at other TFIID-independent RNA Pol II promoters. The results for FBA1 are from B and serve as a comparison. The individual data points are as in B and are not shown in this and the next two panels to facilitate visual comparison. (D) Same as in C at TFIID-dependent promoters. (E) Same at three genes regulated by the Rap1 activator, which is known to recruit the TBP-containing TFIID factor to the promoter (Mencia et al. 2002). FBA1 is from B.
Figure 3.
Figure 3.
TBP turnover at active promoters in the absence of nucleosomes. See also Supplemental Figure S6. (A) Schematic diagram illustrating the possibility that TBP and nucleosomes compete dynamically for promoter binding. (B) Cells from TBP-anchor-away strains carrying either wild-type or a temperature-sensitive spt6 allele (spt6-14) (Bortvin and Winston 1996) were arrested in G1, and rapidly shifted to 39°C for 20 min in order to inactivate Spt6. At T20, cells were brought back to the permissive temperature. After a 60-min recovery period (T80), rapamycin was added to the culture to deplete TBP from the nucleus. (C) (Upper panel) Nucleosome occupancy just before (T0) and at 80-min (T80) after transient heat inactivation of Spt6 was measured at the indicated TFIID-independent and TFIID-dependent promoters by quantitative ChIP using antibodies against core histone H3. The ChIP signals for each gene are expressed relative to those measured at T0 (=100) in the wild-type Spt6 strain (WT). (Lower panel) TBP occupancy at the same promoters was determined prior to (T0*) and at the indicated time points after addition of rapamycin, as in Figure 2. Note that T0* corresponds to the T80 time point in the upper panel. This experiment was performed in a strain bearing a wild-type TOR1 allele (see Supplemental Methods).
Figure 4.
Figure 4.
Nucleosome turnover in the absence of TBP. See also Supplemental Figure S7. (A) Cells from a TBP-anchor-away strain expressing a galactose-inducible HA-tagged version of histone H3 (H3HA) from a single copy plasmid were grown overnight in raffinose before being arrested in G1 with alpha factor. Galactose was then added directly to the medium at T0 to induce expression of H3HA. Glucose was added 10 min later (T10) to suppress further expression of H3HA, or rapamycin was added to deplete TBP from the nucleus. Culture aliquots were removed at these and subsequent time points and directly processed for Western blot and ChIP analyses. H3HA and TBPFRB protein levels in whole-cell extracts prepared before cross-linking were assessed using anti-HA and anti-TBP antibodies. G6PDH served as a loading control. Note that the left and right panels are from the same gel exposure for each protein and are directly comparable. (B) TBP promoter occupancy at the highly transcribed CDC19 and ADH1 genes and at the silent STE3 gene was measured at the indicated time points after galactose addition, as in Figure 2. The results are expressed relative to the T0 value for CDC19, which was set to 100. (C) H3HA incorporation at the same promoters and time points after addition of glucose or rapamycin (red curves) to deplete TBP. The values are expressed as percentage of input DNA recovered.

References

    1. Adelman K, Lis JT 2012. Promoter-proximal pausing of RNA polymerase II: Emerging roles in metazoans. Nat Rev Genet 13: 720–731 - PMC - PubMed
    1. Adkins MW, Tyler JK 2006. Transcriptional activators are dispensable for transcription in the absence of Spt6-mediated chromatin reassembly of promoter regions. Mol Cell 21: 405–416 - PubMed
    1. Bernstein BE, Liu CL, Humphrey EL, Perlstein EO, Schreiber SL 2004. Global nucleosome occupancy in yeast. Genome Biol 5: R62. - PMC - PubMed
    1. Bhaumik SR 2011. Distinct regulatory mechanisms of eukaryotic transcriptional activation by SAGA and TFIID. Biochim Biophys Acta 1809: 97–108 - PMC - PubMed
    1. Bortvin A, Winston F 1996. Evidence that Spt6p controls chromatin structure by a direct interaction with histones. Science 272: 1473–1476 - PubMed

Publication types

MeSH terms

Associated data

LinkOut - more resources