

Analyzing Propensity Matched Zero-Inflated Count Outcomes in Observational Studies
- PMID: 24298197
- PMCID: PMC3843491
- DOI: 10.1080/02664763.2013.834296
Analyzing Propensity Matched Zero-Inflated Count Outcomes in Observational Studies
Abstract
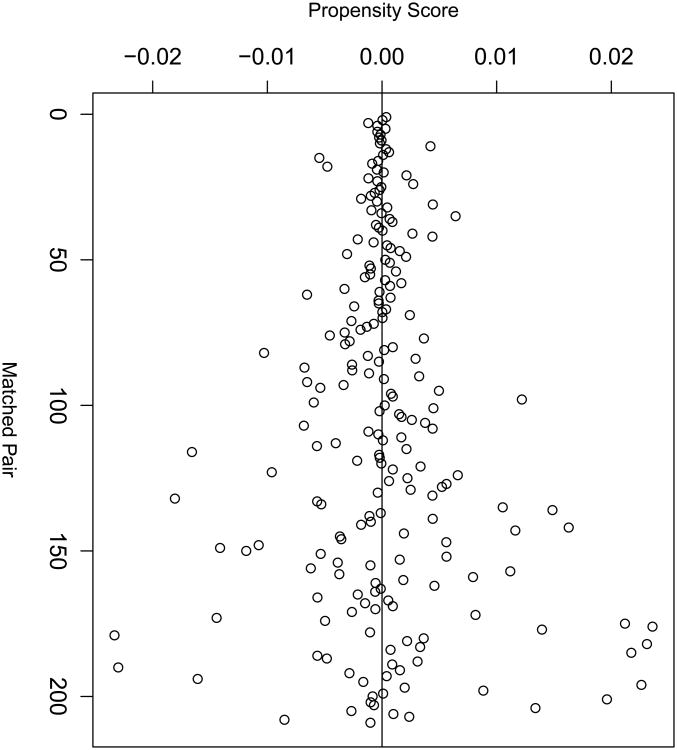
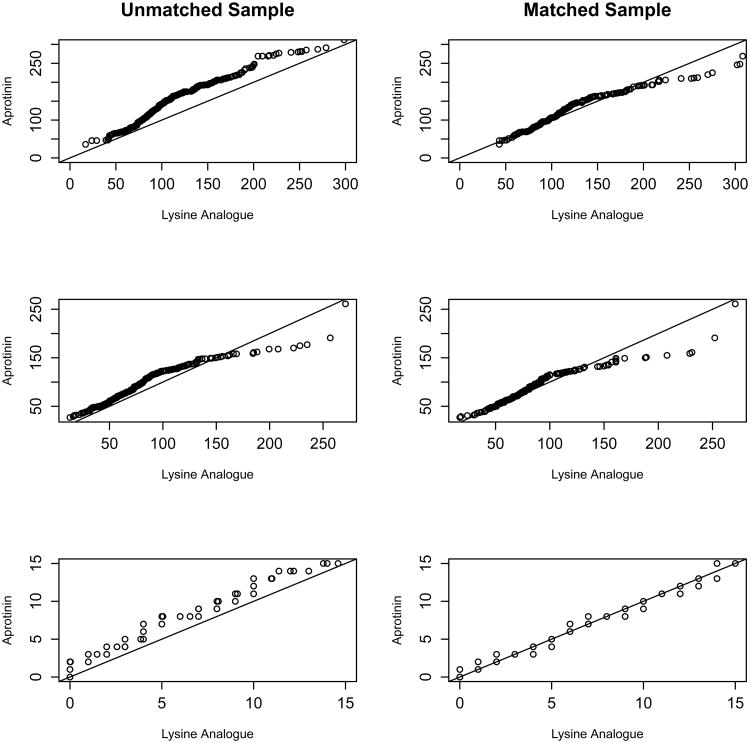
Determining the effectiveness of different treatments from observational data, which are characterized by imbalance between groups due to lack of randomization, is challenging. Propensity matching is often used to rectify imbalances among prognostic variables. However, there are no guidelines on how appropriately to analyze group matched data when the outcome is a zero inflated count. In addition, there is debate over whether to account for correlation of responses induced by matching, and/or whether to adjust for variables used in generating the propensity score in the final analysis. The aim of this research is to compare covariate unadjusted and adjusted zero-inflated Poisson models that do and do not account for the correlation. A simulation study is conducted, demonstrating that it is necessary to adjust for potential residual confounding, but that accounting for correlation is less important. The methods are applied to a biomedical research data set.
Keywords: Poisson; count data; propensity matching; random effects; zero inflation.
Figures
References
-
- Austin PC, Rothwell DM, V J. A comparison of statistical modeling strategies for analyzing length of stay after CABG surgery. Health Services and Outcomes Research Methodology. 2002;3:107–133.
-
- Austin PC. A critical appraisal of propensity-score matching in the medical literature between 1996 and 2003. Statistics in Medicine. 2008;27:2037–2049. - PubMed
Grants and funding
LinkOut - more resources
Full Text Sources
Other Literature Sources