. 2013 May 24;11(4):480-97.
doi: 10.2203/dose-response.13-005.Doss. eCollection 2013.

Linear No-Threshold Model VS. Radiation Hormesis

Affiliations

Linear No-Threshold Model VS. Radiation Hormesis

Mohan Doss. Dose Response. .

Abstract

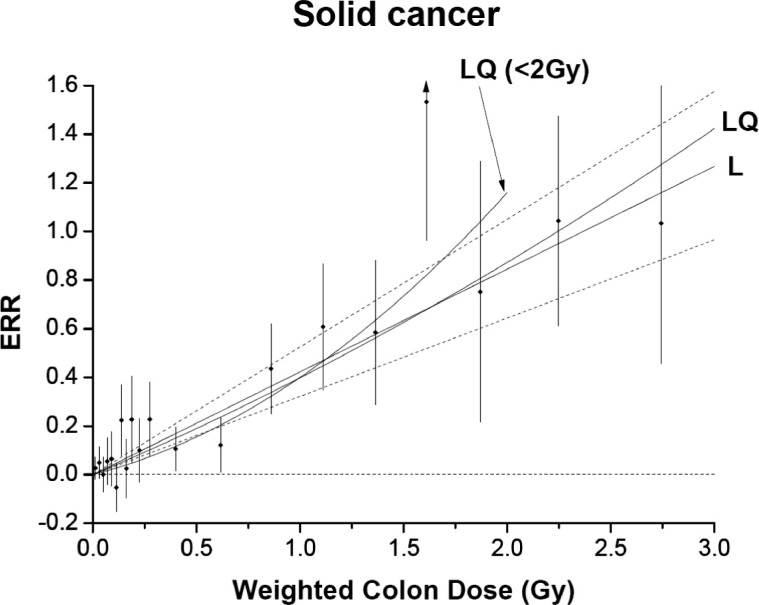
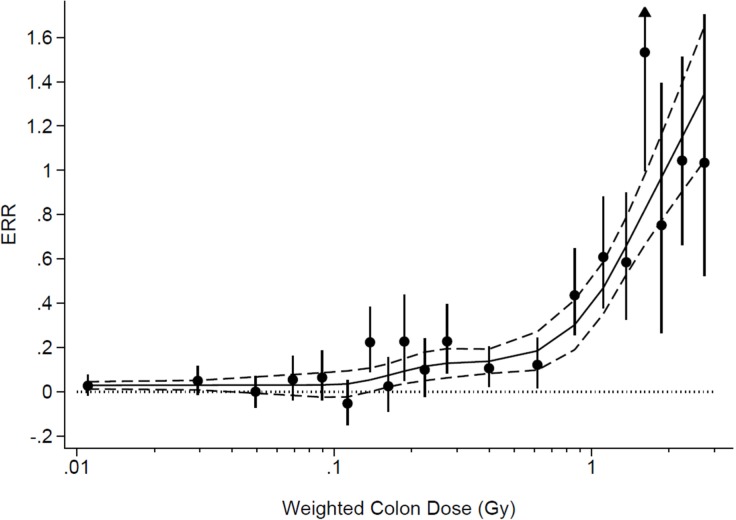
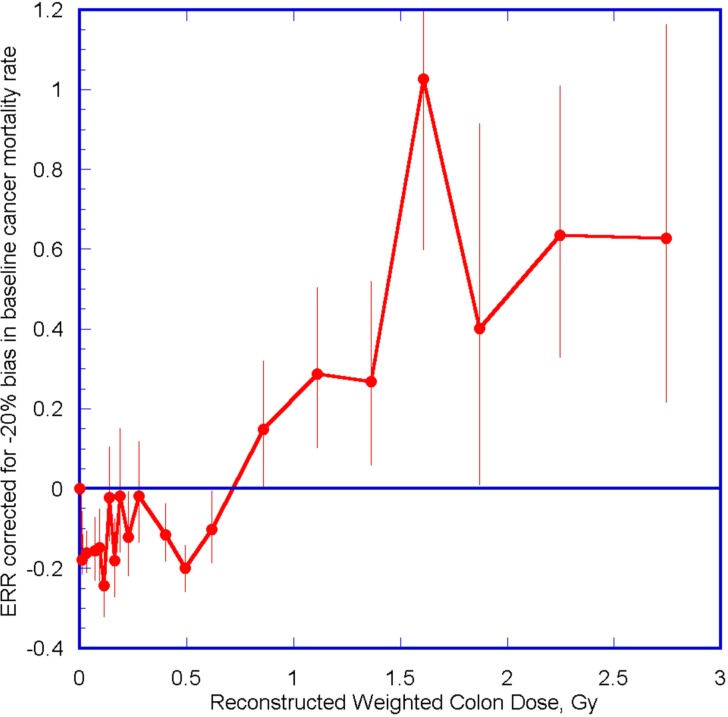
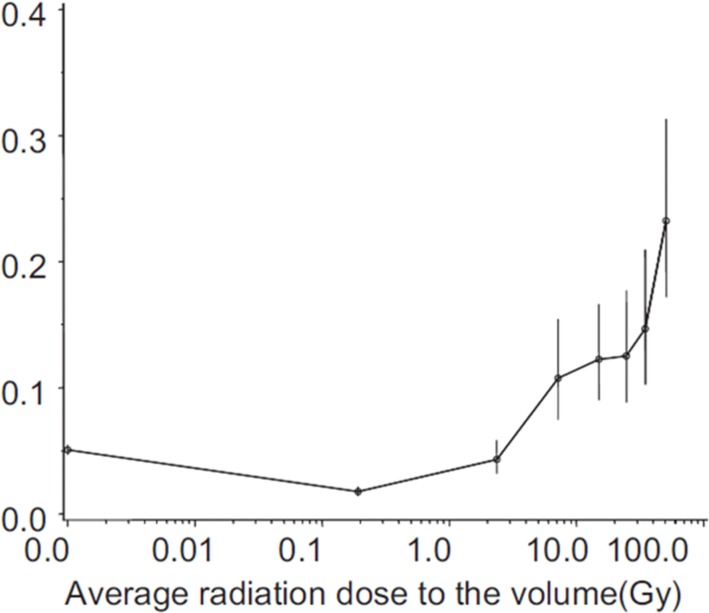
The atomic bomb survivor cancer mortality data have been used in the past to justify the use of the linear no-threshold (LNT) model for estimating the carcinogenic effects of low dose radiation. An analysis of the recently updated atomic bomb survivor cancer mortality dose-response data shows that the data no longer support the LNT model but are consistent with a radiation hormesis model when a correction is applied for a likely bias in the baseline cancer mortality rate. If the validity of the phenomenon of radiation hormesis is confirmed in prospective human pilot studies, and is applied to the wider population, it could result in a considerable reduction in cancers. The idea of using radiation hormesis to prevent cancers was proposed more than three decades ago, but was never investigated in humans to determine its validity because of the dominance of the LNT model and the consequent carcinogenic concerns regarding low dose radiation. Since cancer continues to be a major health problem and the age-adjusted cancer mortality rates have declined by only ∼10% in the past 45 years, it may be prudent to investigate radiation hormesis as an alternative approach to reduce cancers. Prompt action is urged.

Keywords: Adaptive Response; Atomic Bomb Survivors; LNT Model; Radiation Hormesis.


Figures

FIGURE 1.
FIGURE 1.
From Ozasa et al. (Ozasa et al., 2013). Excess relative risk (ERR) for all solid cancer mortality in atomic bomb survivors in relation to radiation exposure. The black circles represent ERR and 95% CI for the dose categories, together with trend estimates based on linear (L) with 95% CI (dotted lines) and linear-quadratic (LQ) models using the full dose range, and LQ model for the data restricted to dose < 2 Gy. Figure reproduced with permission from the Radiation Research Society.
FIGURE 2.
FIGURE 2.
Excess relative risk (ERR) for all solid cancer in atomic bomb survivors in relation to radiation exposure. The black circles and error bars represent ERR and 95% CIs for the dose categories. Data from (Ozasa et al., 2013). Solid Line - fit to the ERR data using a multiple linear regression in which weighted log colon dose was entered into the model using a restricted cubic spline transformation with five knots. Regression weights were equal to the inverse of the variance of the point estimates. Dashed lines are 95% CI of the fit. Figure from performing analysis equivalent to (Doss et al., 2012) with the corrected data in (Ozasa et al., 2013). Figure provided by Brian L. Egleston.
FIGURE 3.
FIGURE 3.
Excess relative risk (ERR) for all solid cancer mortality in atomic bomb survivors corrected for −20% bias in baseline cancer mortality rate plotted as a function of colon dose. Error bars are 95% CI. The obvious requirement that ERR = 0 at zero dose has been added as an additional data point.
FIGURE 4.
FIGURE 4.
From (Tubiana et al., 2011). Second cancers per kg according to the mean dose received in volume in radiation therapy patients. Figure reproduced with permission from Health Physics.
FIGURE 5.
FIGURE 5.
From (Sakamoto, 2004). Survival of Stage I and II non-Hodgkin’s lymphoma patients following interspersed low-dose total-body or half-body irradiation between local radiation therapy treatments compared to local radiation therapy treatments only. Figure reproduced with permission from Nonlinearity in Biology Toxicology and Medicine.
FIGURE 6.
FIGURE 6.
From (Remington and Brownson, 2011). Trends in age-adjusted death rates for the leading chronic diseases in United States for 1960–2007.

References

    1. Berrington de Gonzalez A, Mahesh M, Kim KP, Bhargavan M, Lewis R, Mettler F, Land C. Projected cancer risks from computed tomographic scans performed in the United States in 2007. Arch Intern Med. 2009;169:2071–7. - PMC - PubMed
    1. Brenner DJ, Hall EJ. Computed tomography—an increasing source of radiation exposure. N Engl J Med. 2007;357:2277–84. - PubMed
    1. Calabrese EJ. The road to linearity: why linearity at low doses became the basis for carcinogen risk assessment. Arch Toxicol. 2009;83:203–25. - PubMed
    1. Calabrese EJ, Baldwin LA. Hormesis: the dose-response revolution. Annu Rev Pharmacol Toxicol. 2003;43:175–97. - PubMed
    1. Cameron JR. Argument against the motion that the LNT model is appropriate for the estimation of risk from low-level (less than 100 mSv/year) radiation. Med Phys. 1998;25:276. - PubMed

LinkOut - more resources