

Prefrontal activation during inhibitory control measured by near-infrared spectroscopy for differentiating between autism spectrum disorders and attention deficit hyperactivity disorder in adults
- PMID: 24298446
- PMCID: PMC3842411
- DOI: 10.1016/j.nicl.2013.10.002
Prefrontal activation during inhibitory control measured by near-infrared spectroscopy for differentiating between autism spectrum disorders and attention deficit hyperactivity disorder in adults
Abstract
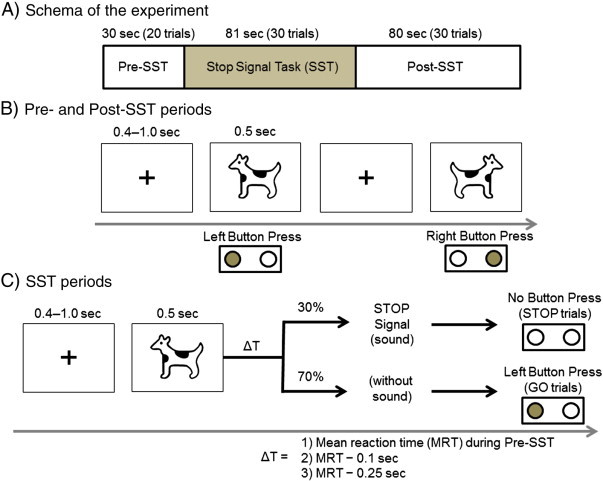
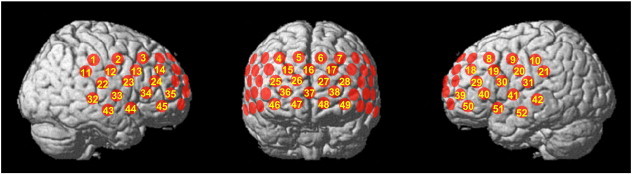
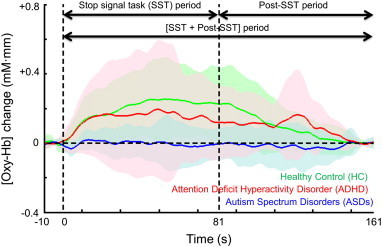
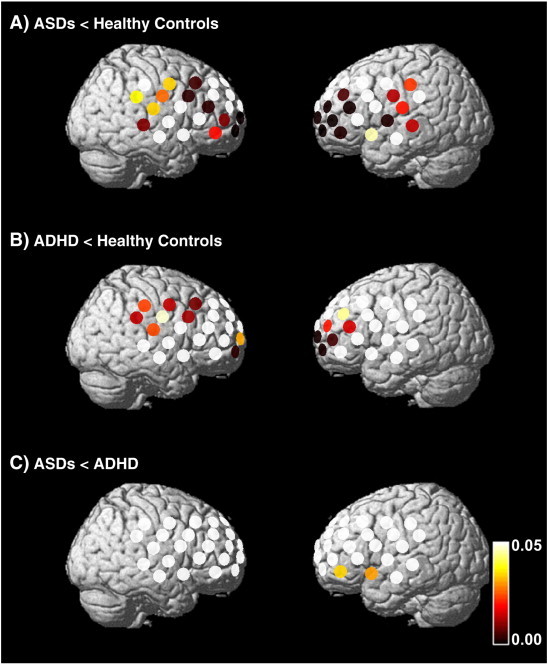
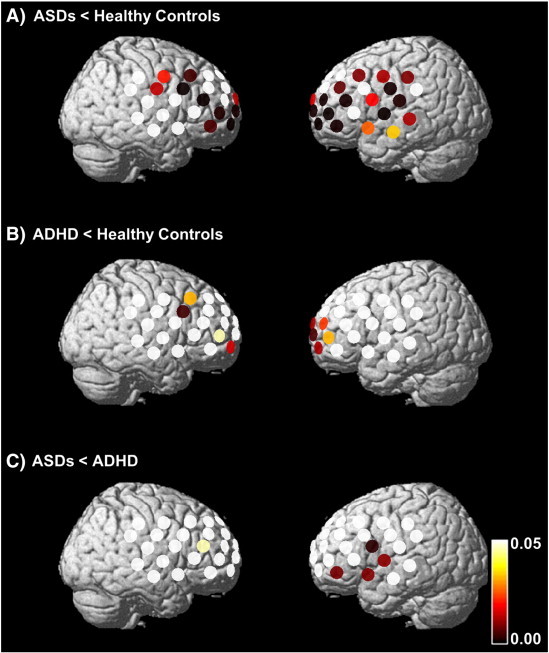
The differential diagnosis of autism spectrum disorders (ASDs) and attention deficit hyperactivity disorder (ADHD) based solely on symptomatic and behavioral assessments can be difficult, even for experts. Thus, the development of a neuroimaging marker that differentiates ASDs from ADHD would be an important contribution to this field. We assessed the differences in prefrontal activation between adults with ASDs and ADHD using an entirely non-invasive and portable neuroimaging tool, near-infrared spectroscopy. This study included 21 drug-naïve adults with ASDs, 19 drug-naïve adults with ADHD, and 21 healthy subjects matched for age, sex, and IQ. Oxygenated hemoglobin concentration changes in the prefrontal cortex were assessed during a stop signal task and a verbal fluency task. During the stop signal task, compared to the control group, the ASDs group exhibited lower activation in a broad prefrontal area, whereas the ADHD group showed underactivation of the right premotor area, right presupplementary motor area, and bilateral dorsolateral prefrontal cortices. Significant differences were observed in the left ventrolateral prefrontal cortex between the ASDs and ADHD groups during the stop signal task. The leave-one-out cross-validation method using mean oxygenated hemoglobin changes yielded a classification accuracy of 81.4% during inhibitory control. These results were task specific, as the brain activation pattern observed during the verbal fluency task did not differentiate the ASDs and ADHD groups significantly. This study therefore provides evidence of a difference in left ventrolateral prefrontal activation during inhibitory control between adults with ASDs and ADHD. Thus, near-infrared spectroscopy may be useful as an auxiliary tool for the differential diagnosis of such developmental disorders.
Keywords: Attention deficit hyperactivity disorder; Autism spectrum disorders; Inhibitory control; Near-infrared spectroscopy; Stop signal task.
Figures
References
-
- Abell F., Krams M., Ashburner J., Passingham R., Friston K., Frackowiak R., Happe F., Frith C., Frith U. The neuroanatomy of autism: a voxel-based whole brain analysis of structural scans. Neuroreport. 1999;10:1647–1651. - PubMed
-
- Alexander G.E., DeLong M.R., Strick P.L. Parallel organization of functionally segregated circuits linking basal ganglia and cortex. Annu. Rev. Neurosci. 1986;9:357–381. - PubMed
-
- American Psychiatric Association . 4th edn. American Psychiatric Association; Washington, DC: 2000. Diagnostic and Statistical Manual of Mental Disorders. Text Revision; pp. 69–93.
-
- Atkinson M., Hollis C. NICE guideline: attention deficit hyperactivity disorder. Arch. Dis. Child. Educ. Pract. Ed. 2010;95:24–27. - PubMed
-
- Autism Network (RUPP) Randomized, controlled, crossover trial of methylphenidate in pervasive developmental disorders with hyperactivity. Arch. Gen. Psychiatry. 2005;62:1266–1274. - PubMed
MeSH terms
Substances
LinkOut - more resources
Full Text Sources
Other Literature Sources
Medical
