. 2013 Dec 3:10:146.
doi: 10.1186/1742-4690-10-146.

Relative resistance of HIV-1 founder viruses to control by interferon-alpha

Affiliations

Relative resistance of HIV-1 founder viruses to control by interferon-alpha

Angharad E Fenton-May et al. Retrovirology. .

Abstract

Background: Following mucosal human immunodeficiency virus type 1 (HIV-1) transmission, type 1 interferons (IFNs) are rapidly induced at sites of initial virus replication in the mucosa and draining lymph nodes. However, the role played by IFN-stimulated antiviral activity in restricting HIV-1 replication during the initial stages of infection is not clear. We hypothesized that if type 1 IFNs exert selective pressure on HIV-1 replication in the earliest stages of infection, the founder viruses that succeed in establishing systemic infection would be more IFN-resistant than viruses replicating during chronic infection, when type 1 IFNs are produced at much lower levels. To address this hypothesis, the relative resistance of virus isolates derived from HIV-1-infected individuals during acute and chronic infection to control by type 1 IFNs was analysed.

Results: The replication of plasma virus isolates generated from subjects acutely infected with HIV-1 and molecularly cloned founder HIV-1 strains could be reduced but not fully suppressed by type 1 IFNs in vitro. The mean IC50 value for IFNα2 (22 U/ml) was lower than that for IFNβ (346 U/ml), although at maximally-inhibitory concentrations both IFN subtypes inhibited virus replication to similar extents. Individual virus isolates exhibited differential susceptibility to inhibition by IFNα2 and IFNβ, likely reflecting variation in resistance to differentially up-regulated IFN-stimulated genes. Virus isolates from subjects acutely infected with HIV-1 were significantly more resistant to in vitro control by IFNα than virus isolates generated from the same individuals during chronic, asymptomatic infection. Viral IFN resistance declined rapidly after the acute phase of infection: in five subjects, viruses derived from six-month consensus molecular clones were significantly more sensitive to the antiviral effects of IFNs than the corresponding founder viruses.

Conclusions: The establishment of systemic HIV-1 infection by relatively IFNα-resistant founder viruses lends strong support to the hypothesis that IFNα plays an important role in the control of HIV-1 replication during the earliest stages of infection, prior to systemic viral spread. These findings suggest that it may be possible to harness the antiviral activity of type 1 IFNs in prophylactic and potentially also therapeutic strategies to combat HIV-1 infection.


Figures

Figure 1
Figure 1
In vitro analysis of the inhibition of HIV-1 replication by IFNα and IFNβ. (A) Comparison of the inhibition of HIV (W6BC) replication when cells were treated with IFNα or IFNβ for 4 hours prior to infection (open bars) or were treated with IFNα or IFNβ both prior to infection and throughout the subsequent viral replication period (filled bars). Viral replication was assessed by measurement of supernatant p24 levels on day 7 post-infection. The results shown are the mean p24 values from 5 replicate wells treated with the indicated concentrations of IFN, expressed as a % of p24 values from cells that were not IFN-treated. Error bars represent 1 standard deviation above the mean. (B) Example of data from assays performed to assess the inhibition of a representative primary HIV-1 isolate (generated from plasma cryopreserved during acute infection from subject MM38) by IFNα and IFNβ. Inhibition of virus replication by each IFN subtype was assessed in two independent assays using mixed PBMCs derived from different groups of donors (black and grey bars). The results shown are the mean p24 values from 4 replicate wells treated with the indicated concentrations of IFN, expressed as a % of p24 values from cells that were not IFN-treated. Error bars represent 1 standard deviation above the mean. (C) Calculation of Vres and IC50 values from a representative IFN inhibition assay (the first IFNβ assay performed on the acute time-point virus isolate from subject MM38 in B). The level of viral replication in the presence of IFNβ (mean supernatant p24 concentration, expressed as a percentage of the mean p24 concentration in the absence of IFN) is plotted against the IFNβ concentration and a curve fitted to the data by non-linear regression using a least squares method. The Vres value (level of virus replication observed in the presence of maximally-suppressive IFN concentrations) is indicated by the dotted line. The IC50 value (IFN concentration required to produce half-maximal inhibition of viral replication i.e. midway between 100% replication and Vres) is read off from the inhibition curve as indicated by the dashed line.
Figure 2
Figure 2
Resistance of plasma virus isolates generated from subjects acutely infected with HIV-1 to in vitro control by IFN-α and IFN-β. (A) IFNα (filled circles) and IFNβ (open triangles) IC50 values of virus isolates generated from different subjects during acute HIV infection; and (B) IFNα (filled circles) and IFNβ (open triangles) Vres values of these virus isolates. Each datapoint represents the mean (of results obtained in a minimum of 2 independent IFN inhibition assays) IC50 or Vres value calculated for a given virus isolate. The horizontal lines show the group mean IC50 or Vres values, plus and minus one standard error. (C) Inhibition of the replication of individual HIV-1 isolates at different IFN concentrations. The level of replication of each virus isolate in the presence of different concentrations of IFNα or IFNβ (mean supernatant p24 concentration, expressed as a percentage of the mean p24 concentration in the absence of IFN) was evaluated in a minimum of two independent assays, the mean of results from which is plotted against the IFN concentration, expressed on a linear scale to illustrate viral replication in the presence of high IFN concentrations. Clusters of virus isolates that exhibit shared patterns of relative resistance to control by IFNα and IFNβ are indicated by the bold solid, long-dashed and short-dashed lines.
Figure 3
Figure 3
Relationship between the IFN resistance of acute time-point virus isolates and the setpoint persisting viral load established in the subjects from which they were derived. (A) IC50 values; and (B) Vres values of plasma virus isolates generated from different subjects during acute HIV infection are plotted against the setpoint persisting viral load subsequently established in the individual concerned in the absence of ART. Solid circles denote IC50 and Vres data for IFN-α and open triangles denote IC50 and Vres data for IFN-β. The data shown are the mean of results from a minimum of 2 independent IFNα or IFNβ assays performed with each virus using different donor PBMC mixes.
Figure 4
Figure 4
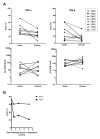
Comparison of the type 1 IFN resistance of virus isolates generated from HIV-infected individuals during acute and chronic, asymptomatic infection. (A) IFNα (left panels) and IFNβ (right panels) Vres (upper half of figure) and IC50 (lower half of figure) values of pairs of virus isolates generated from the same subjects at time-points in acute infection and chronic asymptomatic infection (after 2–7 years of chronic, untreated infection). (B) IFNα (filled circles) and IFNβ (open triangles) Vres values of virus isolates generated from subject MM23 in acute infection and at the indicated time-points during chronic, untreated infection. The data shown in (A) and (B) are the mean of results from a minimum of 2 independent IFNα or IFNβ assays performed with each virus isolate using different donor PBMC mixes.
Figure 5
Figure 5
IFN-α and IFN-β resistance of viruses generated from IMCs corresponding to the deduced founder virus sequence from subjects in whom systemic HIV infection was established by a single virus. (A) IFNα (filled circles) and IFNβ (open triangles) IC50 values of founder virus IMCs from different subjects; and (B) IFNα (filled circles) and IFNβ (open triangles) Vres values of these founder virus IMCs. Each datapoint represents the mean (of results obtained in a minimum of 2 independent IFN inhibition assays) IC50 or Vres value calculated for a given virus. The horizontal lines show the group mean IC50 or Vres values, plus and minus one standard error.
Figure 6
Figure 6
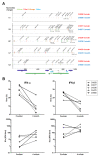
Comparison of the type 1 IFN resistance of viruses generated from IMCs of founder and 6-month consensus virus sequences. (A) Diagrammatic representation of the nucleotide differences between the founder and 6-month consensus (6-mo) IMC pairs from subjects CH058, CH077, CH236, CH470 and CH850. The founder and 6-mo IMC sequences from each subject are represented by horizontal grey lines. The horizontal axis indicates nucleotide positions in the alignment beginning at the start of the U3 region of the 5‘ LTR and extending to the end of the U5 region of the 3’ LTR, based on HXB2 reference sequence numbering (http://www.hiv.lanl.gov/content/sequence/HIV/REVIEWS/HXB2.html). Nucleotide differences between the founder and 6-mo IMC sequences are indicated by tic-marks on the 6-mo sequence, with the colour of the tic-mark indicating the base present in the 6 mo IMC (A in green, T in red, G in orange and C in light blue). Non-synonymous changes are labelled. The total number of nucleotide differences between each founder and 6-mo IMC pair is indicated. (B) IFNα (left panels) and IFNβ (right panels) Vres (upper half of figure) and IC50 (lower half of figure) values of viruses generated from the founder and 6-mo IMCs depicted in (A). The data shown are the mean of results from a minimum of 2 independent IFNα or IFNβ assays performed with each virus using different donor PBMC mixes.

References

    1. Haase AT. Targeting early infection to prevent HIV-1 mucosal transmission. Nature. 2010;10:217–223. doi: 10.1038/nature08757. - DOI - PubMed
    1. Keele BF, Giorgi EE, Salazar-Gonzalez JF, Decker JM, Pham KT, Salazar MG, Sun C, Grayson T, Wang S, Li H. et al.Identification and characterization of transmitted and early founder virus envelopes in primary HIV-1 infection. Proc Natl Acad Sci U S A. 2008;10:7552–7557. doi: 10.1073/pnas.0802203105. - DOI - PMC - PubMed
    1. Abrahams MR, Anderson JA, Giorgi EE, Seoighe C, Mlisana K, Ping LH, Athreya GS, Treurnicht FK, Keele BF, Wood N. et al.Quantitating the multiplicity of infection with human immunodeficiency virus type 1 subtype C reveals a non-poisson distribution of transmitted variants. J Virol. 2009;10:3556–3567. doi: 10.1128/JVI.02132-08. - DOI - PMC - PubMed
    1. McMichael AJ, Borrow P, Tomaras GD, Goonetilleke N, Haynes BF. The immune response during acute HIV-1 infection: clues for vaccine development. Nat Rev Immunol. 2010;10:11–23. doi: 10.1038/nri2674. - DOI - PMC - PubMed
    1. Borrow P. Innate immunity in acute HIV-1 infection. Curr Opin HIV AIDS. 2011;10:353–363. doi: 10.1097/COH.0b013e3283495996. - DOI - PMC - PubMed

Publication types

Substances