

Integrated molecular portrait of non-small cell lung cancers
- PMID: 24299561
- PMCID: PMC4222074
- DOI: 10.1186/1755-8794-6-53
Integrated molecular portrait of non-small cell lung cancers
Abstract
Background: Non-small cell lung cancer (NSCLC), a leading cause of cancer deaths, represents a heterogeneous group of neoplasms, mostly comprising squamous cell carcinoma (SCC), adenocarcinoma (AC) and large-cell carcinoma (LCC). The objectives of this study were to utilize integrated genomic data including copy-number alteration, mRNA, microRNA expression and candidate-gene full sequencing data to characterize the molecular distinctions between AC and SCC.
Methods: Comparative genomic hybridization followed by mutational analysis, gene expression and miRNA microarray profiling were performed on 123 paired tumor and non-tumor tissue samples from patients with NSCLC.
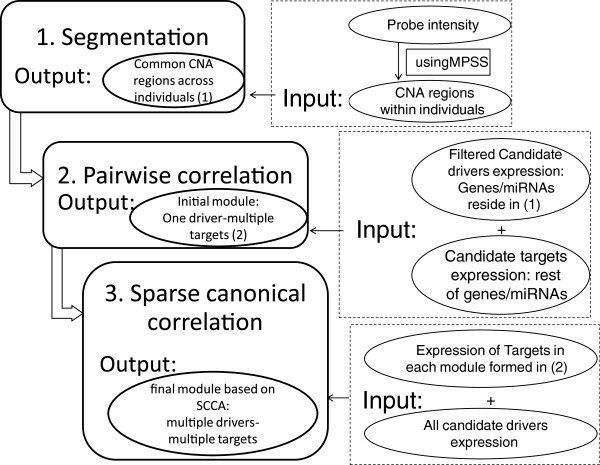
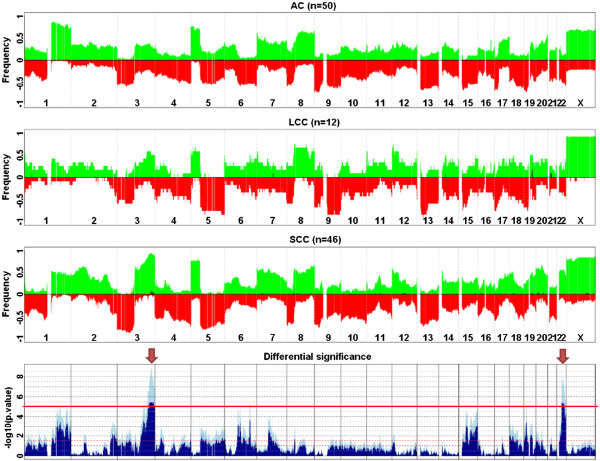
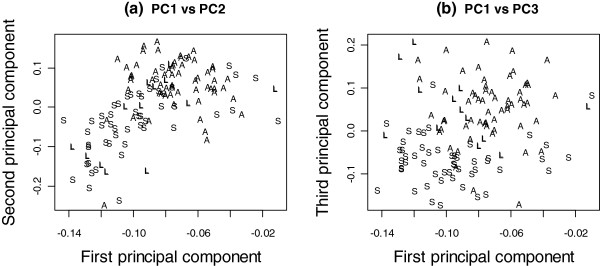
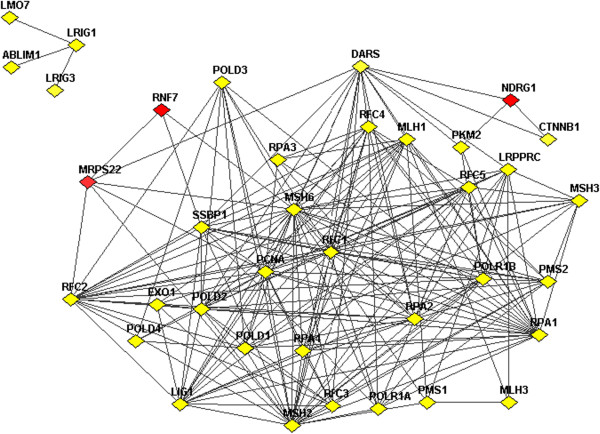
Results: At DNA, mRNA and miRNA levels we could identify molecular markers that discriminated significantly between the various histopathological entities of NSCLC. We identified 34 genomic clusters using aCGH data; several genes exhibited a different profile of aberrations between AC and SCC, including PIK3CA, SOX2, THPO, TP63, PDGFB genes. Gene expression profiling analysis identified SPP1, CTHRC1 and GREM1 as potential biomarkers for early diagnosis of the cancer, and SPINK1 and BMP7 to distinguish between AC and SCC in small biopsies or in blood samples. Using integrated genomics approach we found in recurrently altered regions a list of three potential driver genes, MRPS22, NDRG1 and RNF7, which were consistently over-expressed in amplified regions, had wide-spread correlation with an average of ~800 genes throughout the genome and highly associated with histological types. Using a network enrichment analysis, the targets of these potential drivers were seen to be involved in DNA replication, cell cycle, mismatch repair, p53 signalling pathway and other lung cancer related signalling pathways, and many immunological pathways. Furthermore, we also identified one potential driver miRNA hsa-miR-944.
Conclusions: Integrated molecular characterization of AC and SCC helped identify clinically relevant markers and potential drivers, which are recurrent and stable changes at DNA level that have functional implications at RNA level and have strong association with histological subtypes.
Figures
References
-
- Cagle PT, Allen TC, Dacic S, Beasley MB, Borczuk AC, Chirieac LR, Laucirica R, Ro JY, Kerr KM. Revolution in lung cancer: new challenges for the surgical pathologist. Arch Pathol Lab Med. 2011;135:110–116. - PubMed
MeSH terms
Substances
LinkOut - more resources
Full Text Sources
Other Literature Sources
Medical
Molecular Biology Databases
Research Materials
Miscellaneous
