. 2014 Mar;24(3):496-510.
doi: 10.1101/gr.161034.113. Epub 2013 Dec 3.

From single-cell to cell-pool transcriptomes: stochasticity in gene expression and RNA splicing

Affiliations

From single-cell to cell-pool transcriptomes: stochasticity in gene expression and RNA splicing

Georgi K Marinov et al. Genome Res. 2014 Mar.

Abstract

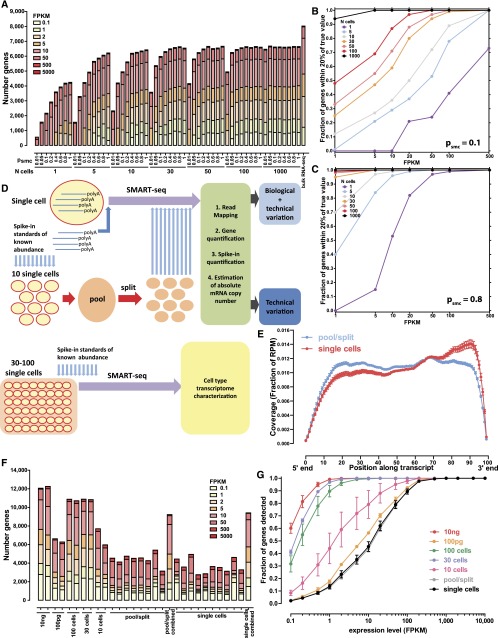
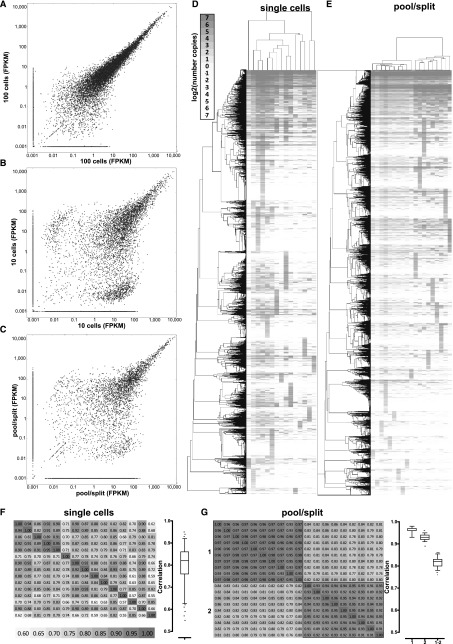
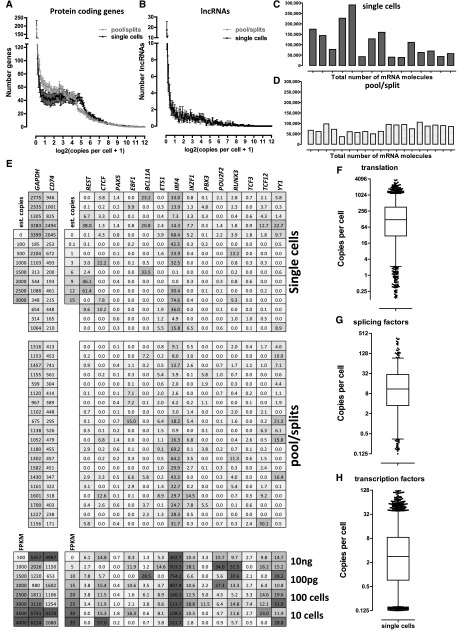
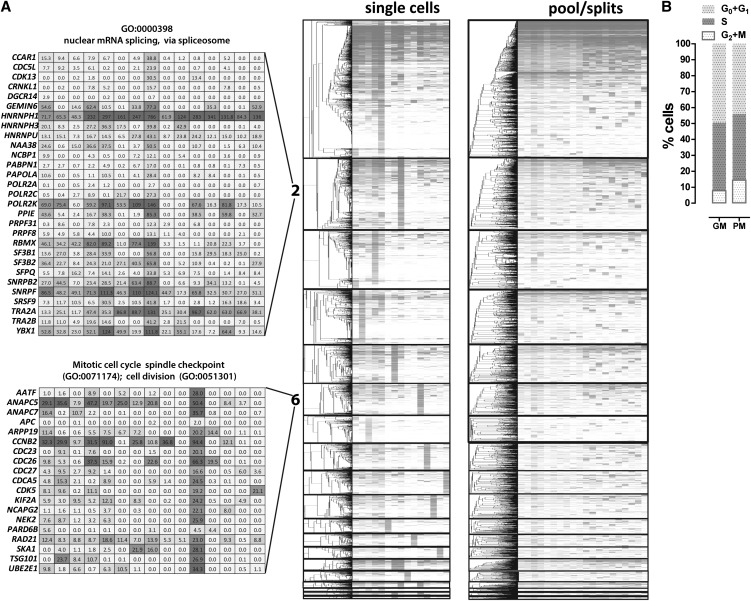
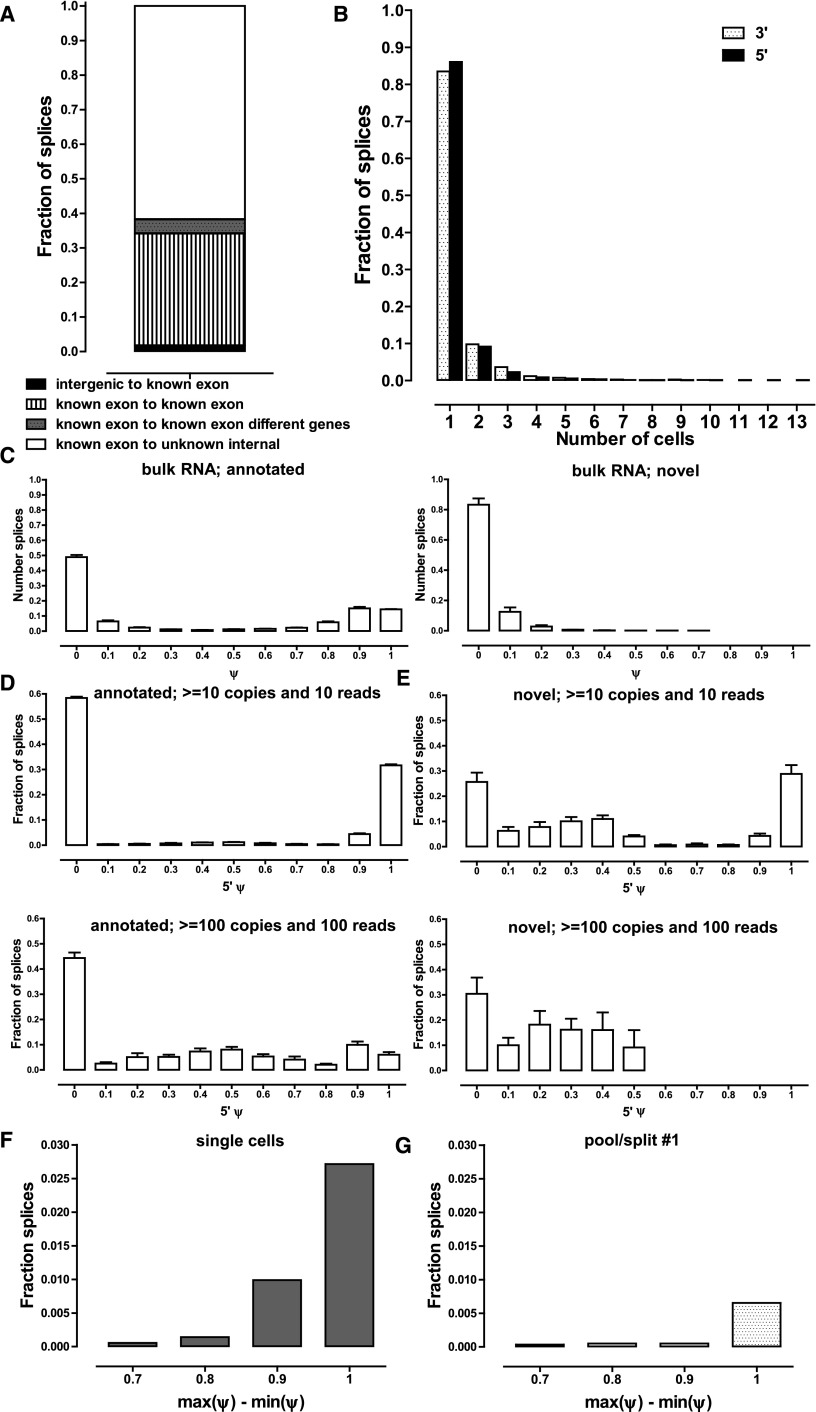
Single-cell RNA-seq mammalian transcriptome studies are at an early stage in uncovering cell-to-cell variation in gene expression, transcript processing and editing, and regulatory module activity. Despite great progress recently, substantial challenges remain, including discriminating biological variation from technical noise. Here we apply the SMART-seq single-cell RNA-seq protocol to study the reference lymphoblastoid cell line GM12878. By using spike-in quantification standards, we estimate the absolute number of RNA molecules per cell for each gene and find significant variation in total mRNA content: between 50,000 and 300,000 transcripts per cell. We directly measure technical stochasticity by a pool/split design and find that there are significant differences in expression between individual cells, over and above technical variation. Specific gene coexpression modules were preferentially expressed in subsets of individual cells, including one enriched for mRNA processing and splicing factors. We assess cell-to-cell variation in alternative splicing and allelic bias and report evidence of significant differences in splice site usage that exceed splice variation in the pool/split comparison. Finally, we show that transcriptomes from small pools of 30-100 cells approach the information content and reproducibility of contemporary RNA-seq from large amounts of input material. Together, our results define an experimental and computational path forward for analyzing gene expression in rare cell types and cell states.


Figures

Figure 1.
Figure 1.
Simulated and measured transcriptome profiles from individual cells and small cell pools. (A) Number of detected genes in simulated data sets as a function of the number of cells pooled and the single molecule capture efficiency (psmc) (assuming 100,000 mRNA molecules per cell). See Supplemental Figure 1 for full details. (B,C) Accuracy of gene expression estimation as a function of the number of cells pooled and the single molecule capture efficiency; psmc = 0.1 in B and psmc = 0.8 in C, 100,000 mRNA molecules per cell assumed. Shown is the fraction of genes at the indicated expression levels in FPKM, whose estimated expression level in FPKM in simulated libraries was within 20% of their true value, after modeling the stochasticity due to the single-molecule capture efficiency of the library-building protocol. See the Methods section and Supplemental Figures 2–11 for full details. Note that the simulation is intended to illuminate the relative effects of the various parameters studied, and the absolute numbers of genes should not be directly compared to the real-life data shown in G. (D) Experimental design. Single cells are combined with spike-in quantification standards and SMART-seq libraries are generated. In parallel, multiple single cells are pooled together and combined with spikes, then lysed and split into the same number of reactions and converted into SMART-seq libraries. Libraries are then sequenced, data processed computationally, and estimates for the absolute number of copies per cell are derived based on the spikes. Variation in pool/split experiments is due to technical stochasticity, while variation in single-cell libraries is a combination of biological variation and technical noise. (E) Uniformity of transcript coverage. Shown is the average coverage along the length of an mRNA for single cells and pool/split experiments. Only mRNAs longer than 1 kb from genes with a single annotated isoform in the RefSeq annotation set were included. See Supplemental Figure 29 for more details. (F) Number of detected protein-coding genes for libraries built from 10 ng and 100 pg of poly(A) RNA, pools of 100, 30, and 10 cells, representative pool/split experiments (individually and summed across all libraries), and representative single cells (individually and summed across all libraries). (G) Fraction of genes from 100-ng bulk poly(A)+ RNA libraries that were detected in pools of 100, 30, or 10 cells, 100 pg of poly(A)+ RNA, pools/split experiments, and single cells. FPKM is shown on the x-axis.
Figure 2.
Figure 2.
Technical and biological variation in single-cell RNA-seq measurements of gene expression. (A) Correlation between expression levels (in FPKM) between two pools of 100 cells. (B) Correlation between expression levels (in FPKM) between two pools of 10 cells. (C) Correlation between expression levels (in FPKM) between two representative pool/split libraries. A pseudocount of 0.001 was added to each data point in the scatter plots for visualization purposes. (D,E) Hierarchical clustering of estimated copies-per-cell values for protein-coding genes in single-cell (D) and pool/split (E) libraries. Pearson correlation was used as a distance metric, and only genes expressed at a level of at least one estimated copy in at least one library were included. (F,G) Correlation between estimated copies-per-cell values for protein-coding genes in single-cell libraries (F) and pool/split libraries (G). Two sets of pool/split experiments (1 and 2) are shown and “1-2” in the boxplot refers to correlations between the two sets, while “1” and “2” refer to correlation within each experiment. Similar plots, but using the Spearman correlation, are shown in Supplemental Figure 32.
Figure 3.
Figure 3.
Absolute expression levels at the single-cell level. FPKM values converted to estimated copies per cell using the spike-in quantification standards are shown. (A) Distribution of expression levels of RefSeq protein-coding genes in estimated copies per cell in single cells and pool/split experiments. (B) Distribution of expression levels of GENCODE v13 lncRNA protein-coding genes in estimated copies per cell in single cells and pool/split experiments. (C) Total number of mRNA copies per cell in single cells. (D) Total number of mRNA copies in pool/split experiments. (E) Expression levels of housekeeping and highly expressed genes (GAPDH, CD74, left panel), and general (CTCF, REST, YY1) and B-cell regulatory (PAX5, EBF1, BCL11A, ETS1, IRF4, IKZF1, PBX3, POU2F2, RUNX3, TCF3, TCF12) transcription factors (right panel). Upper and middle panels show the estimated copies-per-cell numbers for single cells and pool/splits, respectively. The lower panel shows FPKM values for cell pools and bulk RNA libraries. (FH) Distribution of absolute expression levels in copies per cell in single cells for translation initiation, elongation, and termination proteins (F), splicing regulators (G), and transcription factors (H). The list of translation proteins was retrieved from the corresponding GO category annotations downloaded from FuncAssociate 2.0 (Berriz et al. 2009). The list of splicing regulators was obtained from the SpliceAid-F database of human splicing factors (Giulietti et al. 2013). The list of transcription factors used was the one from Vaquerizas et al. (2009). Note that only values ≥0.1 estimated copies per cell were included in these plots, i.e., libraries in which the genes were not detected were excluded.
Figure 4.
Figure 4.
Gene coexpression modules derived from single GM12878 cells. Weighted gene correlation networks were constructed using the WCGNA R package (Langfelder and Horvath 2008). (A) Expression levels and hierarchical clustering of genes within modules (modules are sorted by number, which corresponds to their size) in single cells and pool/split experiments. Only genes are clustered (dendrograms on the left), and the identity of the cells and pool/split experiments is the same in each column (two right panels). The absolute expression values of genes belonging to representative GO categories associated with cell cycle phases (modules 1 and 6) and mRNA processing and splicing (module 2) are also shown. (B) Distribution of cell cycle states in a representative GM12878 cell population, in growth media (GM), and picking media (PM). The fraction of cells in M phase is consistent with one such cell being picked in a sample of 15.
Figure 5.
Figure 5.
Alternative splicing at the single-cell level. (A) Classification of new junctions connecting known splice sites. (B) Frequency of detection of novel splice junctions. Novel junctions for which neither the donor nor acceptor site has been annotated were excluded for reasons described in the main text in both A and B. A threshold of 10 estimated copies and a coverage of 10 reads was applied, but results are essentially the same, independent of the thresholds used (Supplemental Fig. 40A). (C) Distribution of ψ scores in bulk RNA samples for annotated and novel splice junctions. A threshold of 15 reads combined for all splice junctions in which a donor or acceptor site participates was applied. Note that for each ψ1 score there is at least one matching ψ2 ≤ 1 − ψ1 score corresponding to the other alternative junction; in some cases, more than two alternative donor or acceptor sites exist; thus the relative height of the 0 ≤ ψ ≤ 0.1 bar. (D, upper and lower). Distribution of 5′ ψ scores for annotated splice junctions at two different detection thresholds in single-cell libraries (see Supplemental Fig. 41 for more detail). (E, upper and lower) Distribution of 5′ ψ scores for novel splice junctions at two different detection thresholds in single-cell libraries (see Supplemental Fig. 42 for more detail). (F,G) Frequency of major splice site usage switches between individual cells (F) and individual libraries in a pool/split experiment (G). Note the strong support for major splice site use switching across the collection of single cells.

References

    1. The 1000 Genomes Project Consortium. 2012. An integrated map of genetic variation from 1,092 human genomes. Nature 491: 56–65 - PMC - PubMed
    1. Anders S, Huber W 2010. Differential expression analysis for sequence count data. Genome Biol 11: R106. - PMC - PubMed
    1. Berriz GF, Beaver JE, Cenik C, Tasan M, Roth FP 2009. Next generation software for functional trend analysis. Bioinformatics 25: 3043–3044 - PMC - PubMed
    1. Blake WJ, Kaern M, Cantor CR, Collins JJ 2003. Noise in eukaryotic gene expression. Nature 422: 633–637 - PubMed
    1. Bradley RK, Merkin J, Lambert NJ, Burge CB 2012. Alternative splicing of RNA triplets is often regulated and accelerates proteome evolution. PLoS Biol 10: e1001229. - PMC - PubMed

Publication types

Associated data