Epidemiologic contributions to recent cancer trends among HIV-infected people in the United States
- PMID: 24300545
- PMCID: PMC5015650
- DOI: 10.1097/QAD.0000000000000163
Epidemiologic contributions to recent cancer trends among HIV-infected people in the United States
Abstract
Objective: HIV-infected people have elevated risk for some cancers. Changing incidence of these cancers over time may reflect changes in three factors: HIV population demographic structure (e.g. age distribution), general population (background) cancer rates, and HIV-associated relative risks. We assessed the contributions of these factors to time trends for 10 cancers during 1996-2010.
Design: Population-based registry linkage study.
Methods: We applied Poisson models to data from the U.S. HIV/AIDS Cancer Match Study to estimate annual percentage changes (APCs) in incidence rates of AIDS-defining cancers [ADCs: Kaposi sarcoma, non-Hodgkin lymphoma (NHL), and cervical cancer] and seven non-AIDS-defining cancers (NADCs). We evaluated HIV-infected cancer trends with and without adjustment for demographics, trends in background rates, and trends in standardized incidence ratios (SIRs, to capture relative risk).
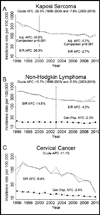
Results: Cancer rates among HIV-infected people rose over time for anal (APC 3.8%), liver (8.5%), and prostate (9.8%) cancers, but declined for Kaposi sarcoma (1996-2000: -29.3%; 2000-2010: -7.8%), NHL (1996-2003: -15.7%; 2003-2010: -5.5%), cervical cancer (-11.1%), Hodgkin lymphoma (-4.0%), and lung cancer (-2.8%). Breast and colorectal cancer incidence did not change over time. Based on comparison to adjusted models, changing demographics contributed to trends for Kaposi sarcoma and breast, colorectal, liver, lung, and prostate cancers (all P < 0.01). Trends in background rates were notable for liver (APC 5.6%) and lung (-3.2%) cancers. SIRs declined for ADCs, Hodgkin lymphoma (APC -3.2%), and lung cancer (-4.4%).
Conclusion: Demographic shifts influenced several cancer trends among HIV-infected individuals. Falling relative risks largely explained ADC declines, while background incidence contributed to some NADC trends.
Conflict of interest statement
All authors declare no conflict of interest.
Figures


Comment in
-
Recent cancer trends in HIV-infected individuals in the United States: clues to global cancer trends in HIV populations.AIDS. 2014 Mar 27;28(6):925-6. doi: 10.1097/QAD.0000000000000164. AIDS. 2014. PMID: 24614065 No abstract available.
References
-
- Patel P, Hanson DL, Sullivan PS, Novak RM, Moorman AC, Tong TC, et al. Incidence of types of cancer among HIV-infected persons compared with the general population in the United States, 1992–2003. Ann Intern Med. 2008;148(10):728–736. - PubMed
-
- Engels EA, Biggar RJ, Hall HI, Cross H, Crutchfield A, Finch JL, et al. Cancer risk in people infected with human immunodeficiency virus in the United States. Int J Cancer. 2008;123(1):187–194. - PubMed
-
- Grulich AE, van Leeuwen MT, Falster MO, Vajdic CM. Incidence of cancers in people with HIV/AIDS compared with immunosuppressed transplant recipients: a meta-analysis. Lancet. 2007;370(9581):59–67. - PubMed
-
- Centers for Disease Control and Prevention. 1993 revised classification system for HIV infection and expanded surveillance case definition for AIDS among adolescents and adults. MMWR Recomm Rep. 1992;41(RR-17):1–19. - PubMed
-
- International Collaboration on HIV and Cancer. Highly active antiretroviral therapy and incidence of cancer in human immunodeficiency virus-infected adults. J Natl Cancer Inst. 2000;92(22):1823–1830. - PubMed
Publication types
MeSH terms
Grants and funding
LinkOut - more resources
Full Text Sources
Other Literature Sources
Medical
Miscellaneous

