Comparative Study
. 2014 Feb;10(2):339-55.
doi: 10.4161/auto.26863. Epub 2013 Nov 26.

Inducing autophagy: a comparative phosphoproteomic study of the cellular response to ammonia and rapamycin

Affiliations
Comparative Study

Inducing autophagy: a comparative phosphoproteomic study of the cellular response to ammonia and rapamycin

Lea M Harder et al. Autophagy. 2014 Feb.

Abstract

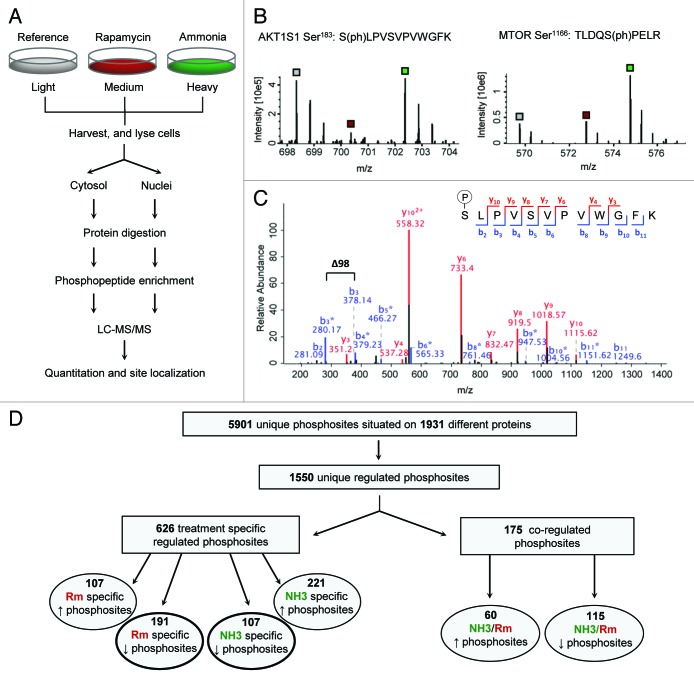
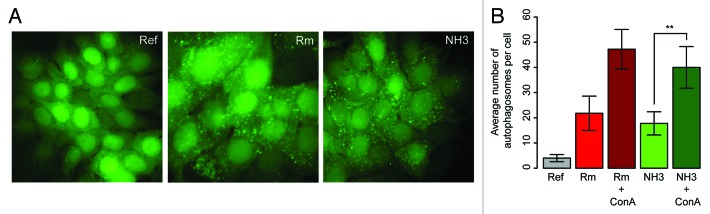
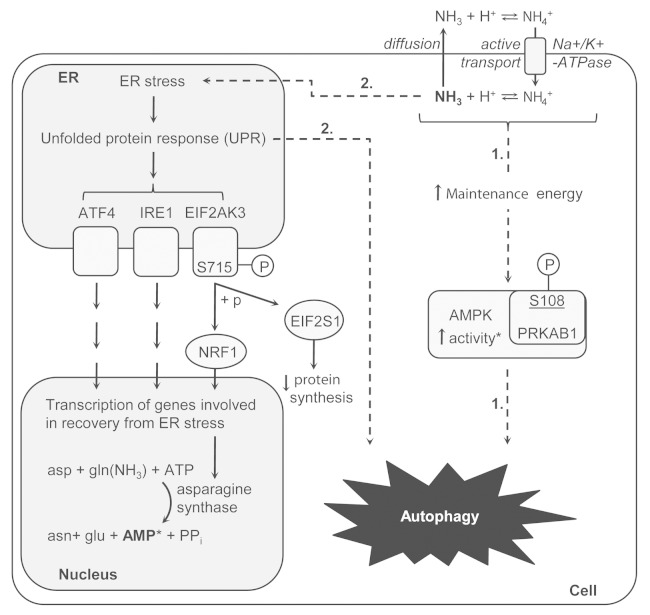
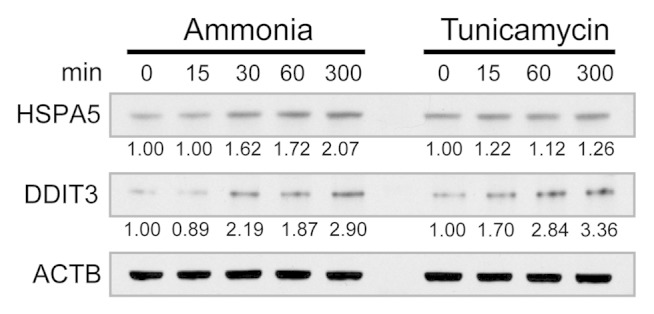
Autophagy is a lysosomal-mediated catabolic process, which through degradation of different cytoplasmic components aids in maintaining cellular homeostasis and survival during exposure to extra- or intracellular stresses. Ammonia is a potential toxic and stress-inducing byproduct of glutamine catabolism, which has recently been found to induce autophagy in an MTOR independent way and support cancer cell survival. In this study, quantitative phosphoproteomics was applied to investigate the initial signaling events linking ammonia to the induction of autophagy. The MTOR inhibitor rapamycin was used as a reference treatment to emphasize the differences between an MTOR-dependent and -independent autophagy-induction. By this means 5901 phosphosites were identified of which 626 were treatment-specific regulated and 175 were coregulated. Investigation of the ammonia-specific regulated sites supported that MTOR activity was not affected, but indicated increased MAPK3 activity, regulation of proteins involved in Rho signal transduction, and a novel phosphorylation motif, serine-proline-threonine (SPT), which could be linked to cytoskeleton-associated proteins. MAPK3 could not be identified as the primary driver of ammonia-induced autophagy but instead the data suggested an upregulation of AMPK and the unfolded protein response (UPR), which might link ammonia to autophagy induction. Support of UPR induction was further obtained from the finding of increased protein levels of the ER stress markers DDIT3/CHOP and HSPA5 during ammonia treatment. The large-scale data set presented here comprises extensive high-quality quantitative information on phosphoprotein regulation in response to 2 very different autophagy inducers and should therefore be considered a general resource for the community.

Keywords: MTOR; ammonia; autophagy; phosphoproteomics; rapamycin; unfolded protein response.


Figures

None
Figure 1. Overview of the experimental and analytical strategy. (A) Flow-scheme of the experimental approach for comparing ammonia- and rapamycin-induced autophagy at the phosphorylation level. Harvested and lysed cells were fractionated into cytosol and nuclei, to facilitate higher resolution in identifications. Proteins were digested and the resulting peptides were subjected to several cycles of phosphopeptide enrichment by TiO2. The fractions were analyzed by LC-MS/MS followed by calculation of peptide ratios and determination of phosphosite localization. (B) MS spectra of phosphopeptides assigned to AKT1S1 or MTOR and specifically regulated by rapamycin or ammonia respectively. Each spectrum displays the isotope pattern of a SILAC triplet with the light, medium, and heavy isotopes marked by the gray, red, and green squares, indicating reference, rapamycin, or ammonia-treated cells, respectively. The differences in intensities between light, medium, and heavy peaks form the basis of calculating phosphopeptide ratios. (C) MS/MS spectrum of the AKT1S1 peptide SLPVSVPVWGFK. Almost the complete sequence can be read from the annotated y- and b-ions series indicated by red and blue font respectively. The mass difference between the b3- and b3*-ion of 98 Da indicating a neutral loss of phosphoric acid from the peptide fragment “SLP” specifically localizes the phosphogroup to the first serine in the peptide sequence. (D) Overview of the total number of phosphosite identifications; 5901 unique phosphosites were identified on 1931 different proteins of which 1550 sites were considered regulated. These were filtered to 626 treatment-specific regulated and 175 coregulated phosphosites, which were finally sorted into groups according to phosphosite up- or downregulation. In the present study, a special emphasis was put on the 2 groups representing rapamycin-specific dephosphorylated- and ammonia-specific phosphorylated sites (the 2 groups encircled by a bold line).
None
Figure 2. Testing the autophagy-inducing properties of ammonia and rapamycin. (A) Fluorescence microscopy of MCF-7 eGFP-LC3 cells being either untreated (Ref), treated for 3 h with 0.55 µM rapamycin (Rm) or treated for 3 h with 4mM ammonia (NH3). (B) Quantification of eGFP-puncta in MCF-7 eGFP-LC3 cells 3h after treatment with rapamycin (Rm) or ammonia (NH3) alone or in combination with ConA or untreated (ref). The quantification was performed using the Metamorph software and bar heights are plotted as mean number of eGFP-LC3 puncta per cell including ± one standard deviation. **P value < 0.01 according to the Student t test.
None
Figure 3. The MTOR response to ammonia and rapamycin at the phosphorylation level. (A) Overview of specifically ammonia- or rapamycin-regulated sites on phosphoproteins immediately downstream of MTOR. The colored symbol above each phosphosite indicates if the site is regulated by ammonia or rapamycin and if it is up- or downregulated. All sites have been identified previously and underscored sites have been reported in the literature as regulated by the indicated kinases (for references see Table 1). (B) Result output from the sequence motif enrichment analysis on the group of rapamycin-specific dephosphorylated proteins using the MotifX algorithm. Significantly enriched motifs is shown (P < 1E-06; binomial test), which are found using a sequence width of 13 and an occurrence threshold of 20 (default parameters in MotifX).
None
Figure 4. GO-term enrichment analysis and identification of ammonia-specific phosphorylated MAPK1/3 targets. (A) Heatmap comparing the results of GO-term enrichment analyses on the groups of rapamycin-specific dephosphorylated proteins and the ammonia-specific phosphorylated proteins. The color code represent −log10 (P value) with the significance threshold set to a P value of 0.05. For the heatmap, the GO-terms have been filtered to include only the most specific terms for a more clear and meaningful output. The GO-terms in the boxes represent particularly interesting terms, which are discussed in the main text. (B) Overview of ammonia-specific regulated phosphoproteins with sites linked directly or indirectly to MAPK1/3 regulation in the literature. The colored symbol above each phosphosite indicates if the site is regulated by ammonia or rapamycin and if it is up- or downregulated. Proteins not identified in this study but representing central parts of the MAPK1/3 signaling cascade is shown in white with dotted outlines. Sites in yellow indicate that phosphorylation of the site enhances the activity of the protein. Sites with an underscore have been noted previously in the literature as regulated by MAPK1/3. -
None
Figure 5. Testing the effect of MAPK1/3 and MAPK14 on ammonia-induced autophagy. (A) Fluorescence microscopy of MCF-7 eGFP-LC3 cells during ammonia-induced autophagy combined with MAPK1/3 or MAPK14 inhibition. As indicated on each picture, cells were kept either unstimulated (Ref) or treated with 4 mM ammonia (NH3) or 10 µM of the MAP2K1/2 and MAPK1/3 inhibitor U0126 alone or in combination with 4 mM ammonia or 10 µM of the MAPK14 inhibitor SB203580 alone or in combination with 4 mM ammonia. (B) Quantification of eGFP-puncta in MCF-7 eGFP-LC3 cells kept either untreated (Ref) or treated for 3 h with ammonia (NH3) alone or in combination with ConA and/or kinase inhibitors U0126 and SB203580 as indicated. The quantification was performed using the Metamorph software and bar heights are plotted as mean number of eGFP-LC3 puncta per cell including ± one standard deviation. **P value < 0.01 according to the Student t test.
None
Figure 6. Morif enrichment analysis of ammonia-specific phosphorylated proteins. (A) Result output from the sequence motif enrichment analysis on the group of ammonia-specific phosphorylated proteins using the MotifX algorithm. Significantly enriched motifs is shown (P < 1E-06; binomial test) with either serine (S) or threonine (T) as central character, a sequence width of 13 and an occurrence threshold of 20 (default parameters in MotifX). (B) Heatmap comparing the results of Cellular Component GO-term enrichment analyses on the 2 groups of ammonia-specific phosphorylated proteins containing either a phosphorylated SPT-motif or a SP-motif (not including SPT). The color code represent –log10(P value) with the significance threshold set to a P value of 0.05. The GO-terms in the red box indicates the group of significant enriched terms, which are specific for the proteins with the SPT-motif.
None
Figure 7. Schematic illustration of the hypotheses for the connection between ammonia and the induction of autophagy. The first route from ammonia to autophagy could be mediated by a disturbance in the energy homeostasis as ammonia was found to upregulate a phosphosite on AMPK, which has been described to be involved in activating AMPK. The disturbance in energy homeostasis could be established as the ammonium ion competes with K+ for entry into the cell via the Na+K+-ATPase. Finally, increased activity of AMPK could ultimately lead to autophagy induction. The second route to autophagy was hypothesized to go through an ammonia-mediated induction of ER stress. The strongest indication of this was the identification of an ammonia-specific upregulated phosphosite (Ser715) on the central UPR protein EIF2AK3, which could indicate EIF2AK3 activation. Activation of the EIF2AK3 branch in particular makes sense during a response to increased levels of ammonia as it leads to upregulation of the transcription of asparagine synthase, which aids in lowering ammonia levels. Further, the asparagine synthase catalyzes a reaction which produces AMP, representing a hypothetical link to AMPK activation.
None
Figure 8. Expression levels of the ER stress markers HSPA and DDIT3 during ammonia treatment. MCF-7 eGFP-LC3 cells were treated with 4 mM ammonia or 5 µg/mL tunicamycin (positive control) for the indicated time intervals and cell lysates were investigated by western blotting with antibodies for HSPA5, DDIT3, and ACTB. The protein expression levels were quantified densitometrically, normalized to reference protein level (ACTB) and renormalized to HSPA5 or DDIT3 protein level at time 0 for each treatment.

References

    1. He C, Klionsky DJ. . Regulation mechanisms and signaling pathways of autophagy. Annu Rev Genet 2009; 43:67 - 93; http://dx.doi.org/ 10.1146/annurev-genet-102808-114910; PMID: 19653858 - DOI - PMC - PubMed
    1. Levine B, Kroemer G. . Autophagy in the pathogenesis of disease. Cell 2008; 132:27 - 42; http://dx.doi.org/ 10.1016/j.cell.2007.12.018; PMID: 18191218 - DOI - PMC - PubMed
    1. Kroemer G, Mariño G, Levine B. . Autophagy and the integrated stress response. Mol Cell 2010; 40:280 - 93; http://dx.doi.org/ 10.1016/j.molcel.2010.09.023; PMID: 20965422 - DOI - PMC - PubMed
    1. Neufeld TP. . TOR-dependent control of autophagy: biting the hand that feeds. Curr Opin Cell Biol 2010; 22:157 - 68; http://dx.doi.org/ 10.1016/j.ceb.2009.11.005; PMID: 20006481 - DOI - PMC - PubMed
    1. Blommaart EF, Luiken JJ, Blommaart PJ, van Woerkom GM, Meijer AJ. . Phosphorylation of ribosomal protein S6 is inhibitory for autophagy in isolated rat hepatocytes. J Biol Chem 1995; 270:2320 - 6; http://dx.doi.org/ 10.1074/jbc.270.5.2320; PMID: 7836465 - DOI - PubMed

Publication types