Review
. 2013 Dec;140(24):4830-43.
doi: 10.1242/dev.100511.

Mechanisms of scaling in pattern formation

Affiliations
Review

Mechanisms of scaling in pattern formation

David M Umulis et al. Development. 2013 Dec.

Abstract

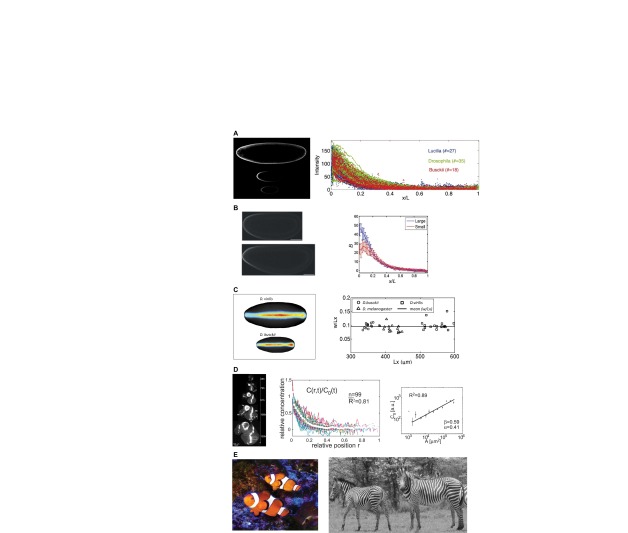
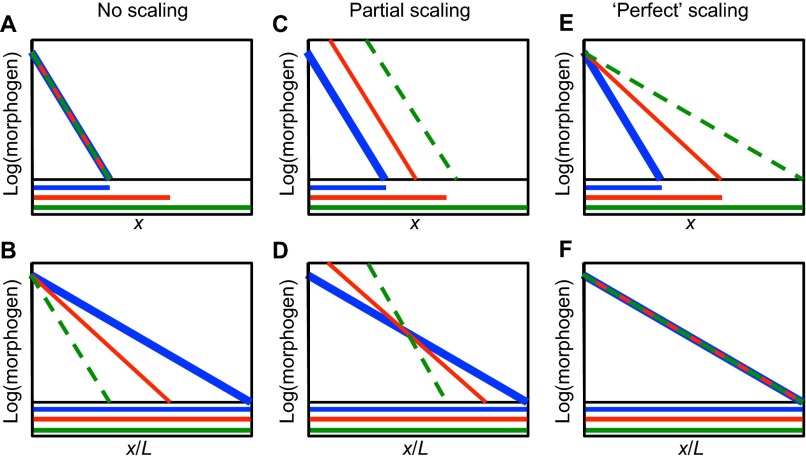
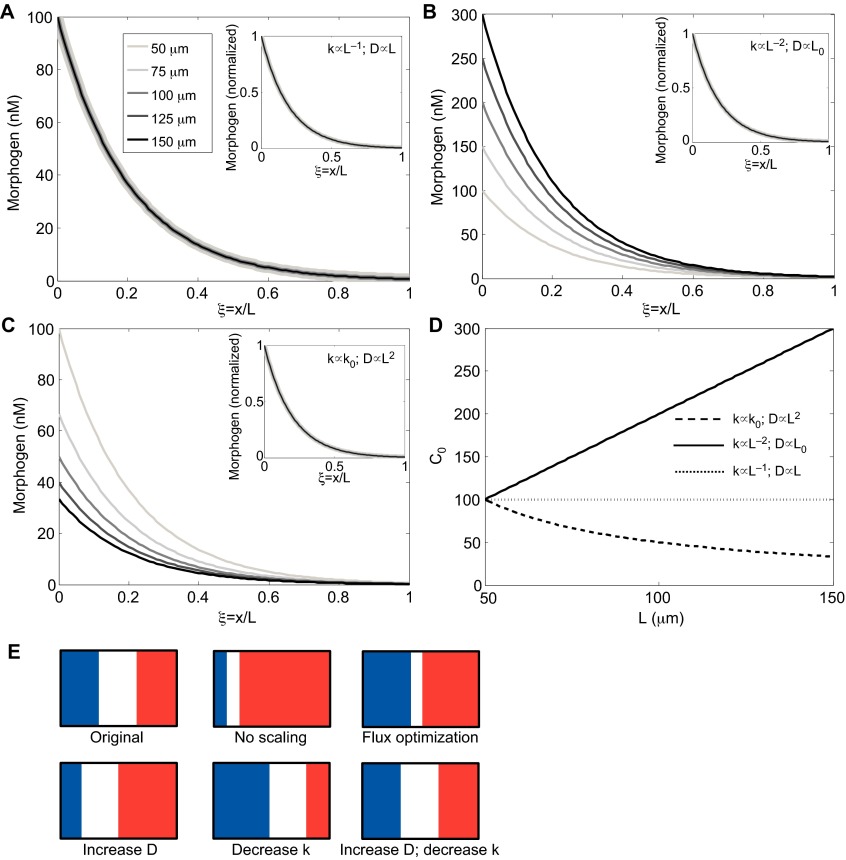
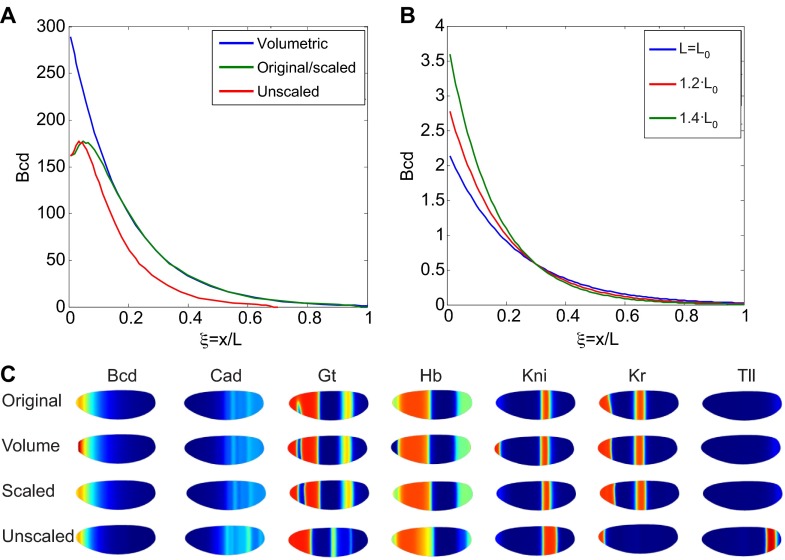
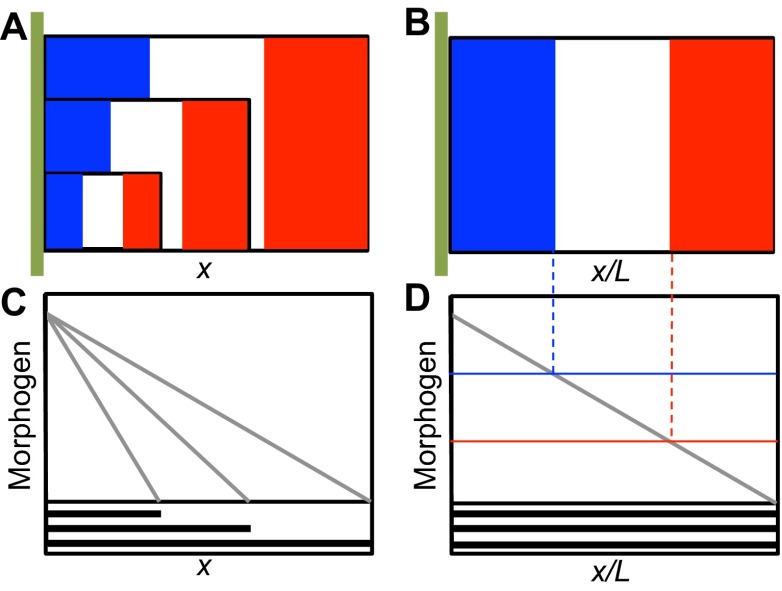
Many organisms and their constituent tissues and organs vary substantially in size but differ little in morphology; they appear to be scaled versions of a common template or pattern. Such scaling involves adjusting the intrinsic scale of spatial patterns of gene expression that are set up during development to the size of the system. Identifying the mechanisms that regulate scaling of patterns at the tissue, organ and organism level during development is a longstanding challenge in biology, but recent molecular-level data and mathematical modeling have shed light on scaling mechanisms in several systems, including Drosophila and Xenopus. Here, we investigate the underlying principles needed for understanding the mechanisms that can produce scale invariance in spatial pattern formation and discuss examples of systems that scale during development.

Keywords: Bone morphogenetic proteins; Mathematical modeling; Morphogen; Pattern formation; Scale invariance; Turing.


Figures

Fig. 1.
Fig. 1.
Scale invariance of patterns in diverse contexts. (A) Interspecies scaling of the Bcd protein distribution in blastoderm embryos. Image (left) shows Bcd immunofluorescence stains for Lucilia sericata (top), Drosophila melanogaster (middle) and Drosophila busckii (bottom). The plot (right) shows the distribution of fluorescence in each species at relative spatial positions. Reproduced from Gregor et al. (Gregor et al., 2005). (B) Intraspecies scaling of the Bcd gradient in Drosophila melanogaster populations that have undergone rounds of artificial selection based on egg size. The image (left) shows a large embryo (bottom) and a small embryo (top). Image brightness was enhanced for clarity. The plot (right) shows the relative Bcd staining intensity for large and small embryos as a function of relative spatial position. Reproduced with permission (Cheung et al., 2011). (C) Scaling of dorsal surface patterning by bone morphogenetic proteins is an example of a complex, highly non-linear spatial patterning system. The image (left) shows the distribution of pMad in a large Drosophila virilis embryo (top) and a small Drosophila busckii embryo (bottom). The plot (right) shows the ratio of average pattern width to embryo length versus the embryo length. A threshold of signaling intensity of 0.2 was used for comparison of widths. Adapted with permission (Umulis et al., 2010). (D) Scaling of the Dpp gradient during growth of the wing imaginal disc is an example of dynamic scaling. The image (left) shows Dpp-GFP expression at various time points during development. Normalized Dpp-GFP profiles from multiple time-points (center) are shown at relative spatial positions. During growth, the amplitude of the morphogen gradient grows (right) in proportion to the length of the disc squared. Adapted with permission (Wartlick et al., 2011). (E) Pigmentation patterns on the skin of the clownfish Amphiprion percula (left; photo by D. M. Umulis) and coat patterns on zebras (right). Zebra image reprinted with permission (Cordingley et al., 2009).
Fig. 2.
Fig. 2.
Schematic profiles showing examples of morphogen distributions that exhibit different degrees of scale invariance. (A-F) Graphs showing the distribution of morphogen on an absolute positional scale (A,C,E) and on a normalized position scale (B,D,E) in short (blue), medium (red) and long (green) domains. The overall system length is L and x is the coordinate. Line colors for the morphogen in the plots correspond to the same colored domain length. Line thicknesses vary so they can be distinguished where they overlap. Examples of no scaling (A,B), partial scaling (C,D) and perfect scaling (E,F) are shown.
Fig. 3.
Fig. 3.
Modules involved in patterning systems. Patterning systems typically comprise four interacting modules: (1) a source module that generates the morphogen signal; (2) a transport module for communicating the signal; (3) a reaction module that interacts with modules 1 and 2 to regulate morphogen gradient shape; and (4) a module for detection and transduction of the signal, interpretation of the transduced signal, and initiation of a response (the DTR module).
Fig. 4.
Fig. 4.
Morphogen transport mechanisms. (A) Example cutaway view of transport through an epithelial layer similar to the wing imaginal disc. The lumenal layer (1) and columnar epithelial cell layer (2) present different obstacles to transport. Arrows indicate free diffusion in the lumen and hindered diffusion between cells in the epithelial cell layer. (B) Transport through the Drosophila blastoderm embryo depends on spatial location and can occur relatively freely through the perivitelline space (1) and through the cortical cytoplasm (2) prior to cellularization. Transport through the yolk (3) may be hindered by higher viscosity, which slows transport. (C-F) Biophysical aspects of transport. (C) General contributions to the amount of a morphogen in a small volume of fluid by flux in and out of the volume and reactions within the volume. Here, j is the flux, Ri is the reaction term, ci is the concentration, A is the cross-sectional area and Δx is the length interval. (D) Cell-mediated transport or transcytosis mechanism (Bollenbach et al., 2005; Kruse et al., 2004). (E) Transport mediated by microtubule motors may provide directed transport or diffusive transport depending on the binding parameters of a molecule to the motor proteins (Hillen and Othmer, 2002; Dou et al., 2012). p+ (p-) is the particle density moving to the right (left); s+ (s-) is the speed of particles moving to the right (left); and λ+-) is the probability of a particle moving to the right (left) changing direction and beginning to move left (right). (F) A mixed or general transport model that integrates the concepts shown in C-E and other forms of molecular motion and reaction.
Fig. 5.
Fig. 5.
Impact of modulating diffusion and decay for linear morphogen decay models. (A-D) Plots of the distributions that result from numerical solution to Eqn 7 are shown. Insets in A-C show distributions for amplitude-normalized profiles. (A) Scaling achieved by simultaneous targeting of diffusion and reaction leads to shape and amplitude scaling without further modification of input flux. (B) Decreasing decay rates in proportion to L2 achieves scaling of the normalized profile (inset), but this leads to an increasing amplitude without a balanced decrease in morphogen input flux. (C) Increasing the diffusion in proportion to L2 results in decreasing amplitudes without a balanced increase in morphogen flux. (D) Summary of changes in maximum concentration in A, B and C. (E) Examples of how the morphogen distributions that arise from the different mechanisms in A, B and C are reflected in the patterning for the French flag paradigm. D, diffusion coefficient; k, decay rate; L, system length.
Fig. 6.
Fig. 6.
Potential interactions between the source/transport/response components and the modulator species. (A) Modulator-mediated control of morphogen distribution and interpretation is shown by red lines. Control of the modulator by the morphogen is indicated by blue lines. (B) Examples of networks for BMP-mediated patterning. The network on the left shows the connections between the morphogens Dpp/Gbb, the extracellular modulators Dally and Pent, and the molecules that impact morphogen interpretation/response (Ltl/Dad) during BMP-mediated patterning of the Drosophila wing disc. The network on the right shows the connections between morphogens (BMP4, ADMP), and extracellular modulators (Sizzled, Xlr, Tsg, CV2 and Chordin) during dorsal/ventral patterning of Xenopus embryos.
Fig. 7.
Fig. 7.
Scaling of the Bcd gradient by adjustment of morphogen range or by volume-dependent production of Bcd. (A) Predicted relative Bcd levels along the AP axis of Drosophila embryos for a volume-dependent production mechanism (blue), a hypothetical perfect scaling mechanism (green) and for no scaling (red) of Bcd. Bcd levels in the original-sized (i.e. base) embryos is shown in green. (B) Predicted Bcd distributions under the flux optimization hypothesis. The individual distributions intersect at x/L=0.3, which is the local region that provides the best scaling. (C) Predicted expression boundaries for the gap genes downstream of the Bcd input shown in A using the models by Hengenius et al. (Hengenius et al., 2011). Spatial patterns of gene expression for original, volume-dependent increase in Bcd, and perfectly scaled Bcd show very similar spatial patterns. Unscaled Bcd predicts dramatic shifts in gap gene expression boundaries.
Fig. 8.
Fig. 8.
Pentagone- and Dally-mediated regulation of Dpp signaling produces active scaling by an ER feedback mechanism. (A) Schematic showing expander-repressor regulation of modulator action on the morphogen Dpp. Expander corresponds to Dally and Pent that feeds back (red lines) to modify the reaction and transport properties of the morphogen Dpp, which subsequently represses the expander (blue line). (B) Predicted distribution of normalized Dpp-Tkv (BR) as a function of relative position in different size discs that range from 60 to 120 μm. Here, the expander-repressor motif correctly adjusts decay length to provide scale invariance during disc growth. Inset shows log scale. (C) Same as in B except all individual profiles are normalized to the amplitude in the 60-μm disc. (In B, each profile is normalized to itself, which leads to each having a maximum amplitude of 1.) The plot shows decreasing morphogen amplitude as a function of disc size and developmental time. Inset shows log scale. Parameters and equations are provided in Ben-Zvi et al. (Ben-Zvi et al., 2011). (D) Core feedback scaling network in the ‘size-sensor’ model (Inomata et al., 2013). Here, feedback from BMP signaling (blue line) works through the modulators (red lines) Sizzled and Xlr to enhance the function of Chordin, which sequesters extracellular BMPs (a negative regulation). The gray arrow shows the net impact of feedback from BMP signaling on Chordin. (E) Proposed behavior for Sizzled in relation to embryo size according to the ‘size-sensor’ model (Inomata et al., 2013).
None

Similar articles

Cited by

References

    1. Alon U. (2007). An Introduction to Systems Biology: Design Principles of Biological Circuits, Vol. 10 Boca Raton, FL: CRC Press;
    1. Aristotle (1910). Historia Animalium (Translation by Thompson D’Arcy Wentworth.). Oxford: Clarendon Press;
    1. Ben-Zvi D., Barkai N. (2010). Scaling of morphogen gradients by an expansion-repression integral feedback control. Proc. Natl. Acad. Sci. USA 107, 6924–6929 - PMC - PubMed
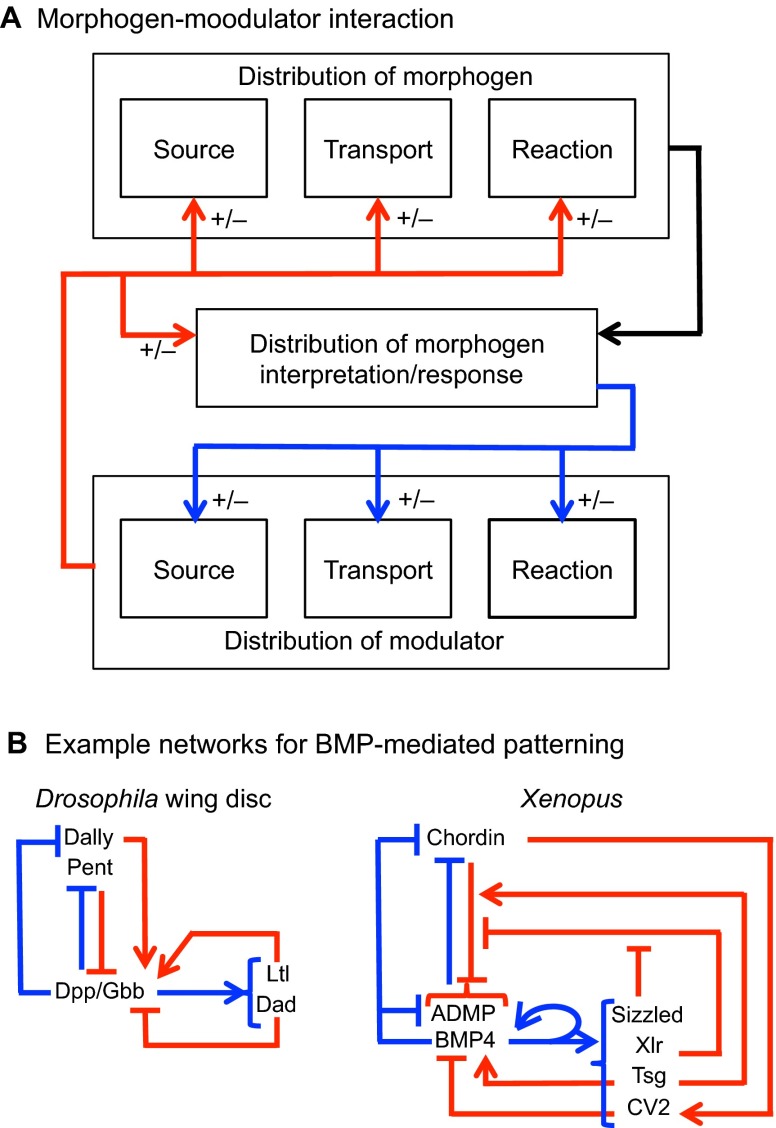
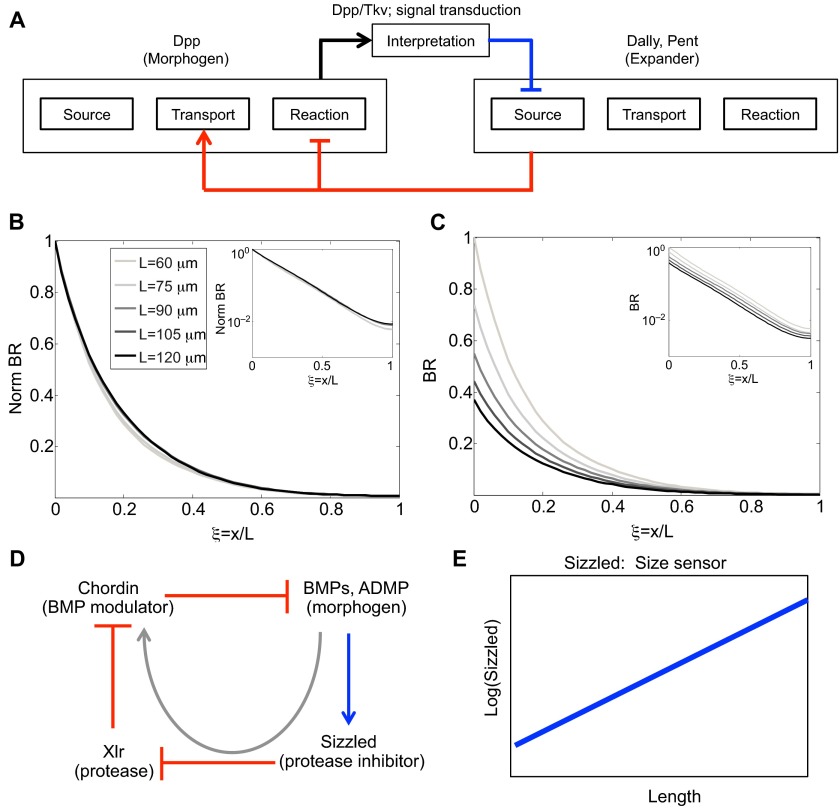
    1. Ben-Zvi D., Shilo B.-Z., Fainsod A., Barkai N. (2008). Scaling of the BMP morphogen activation gradient in Xenopus embryos. Nature 453, 1205–1211 - PubMed
    1. Ben-Zvi D., Pyrowolakis G., Barkai N., Shilo B. Z. (2011). Expansion-repression mechanism for scaling the Dpp activation gradient in Drosophila wing imaginal discs. Curr. Biol. 21, 1391–1396 - PubMed

Publication types

MeSH terms

Substances

LinkOut - more resources