. 2013:4:2890.
doi: 10.1038/ncomms3890.

Structural analysis and mapping of individual protein complexes by infrared nanospectroscopy

Affiliations
Free PMC article

Structural analysis and mapping of individual protein complexes by infrared nanospectroscopy

Iban Amenabar et al. Nat Commun. 2013.
Free PMC article

Abstract

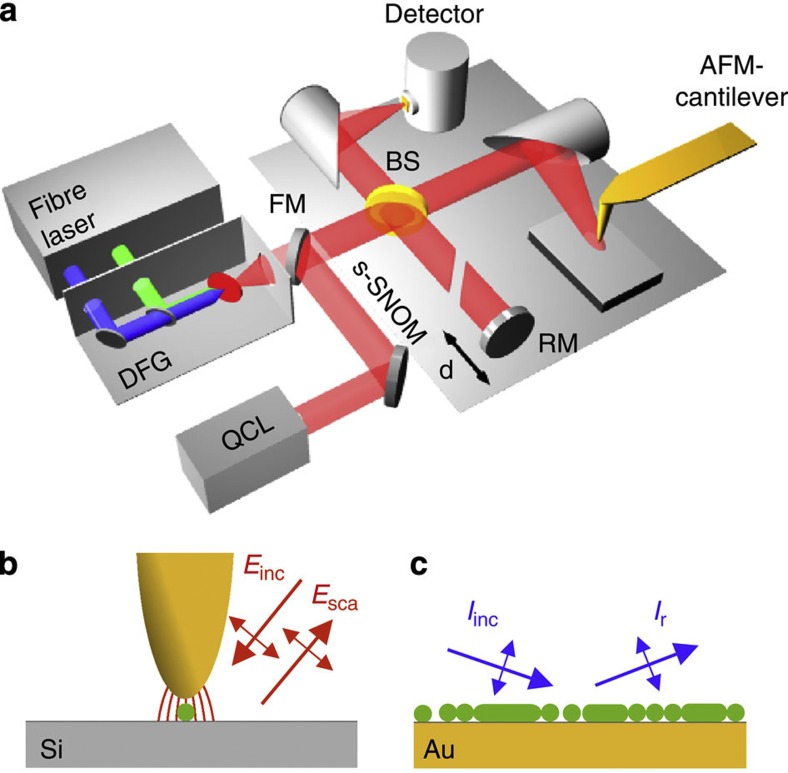
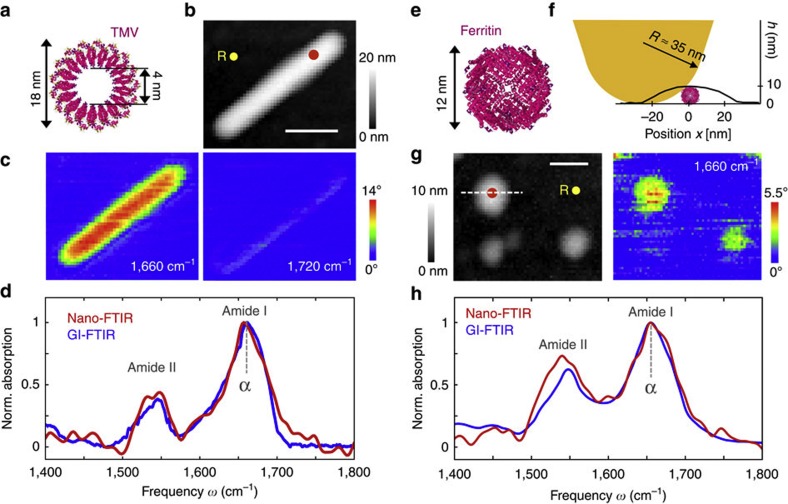
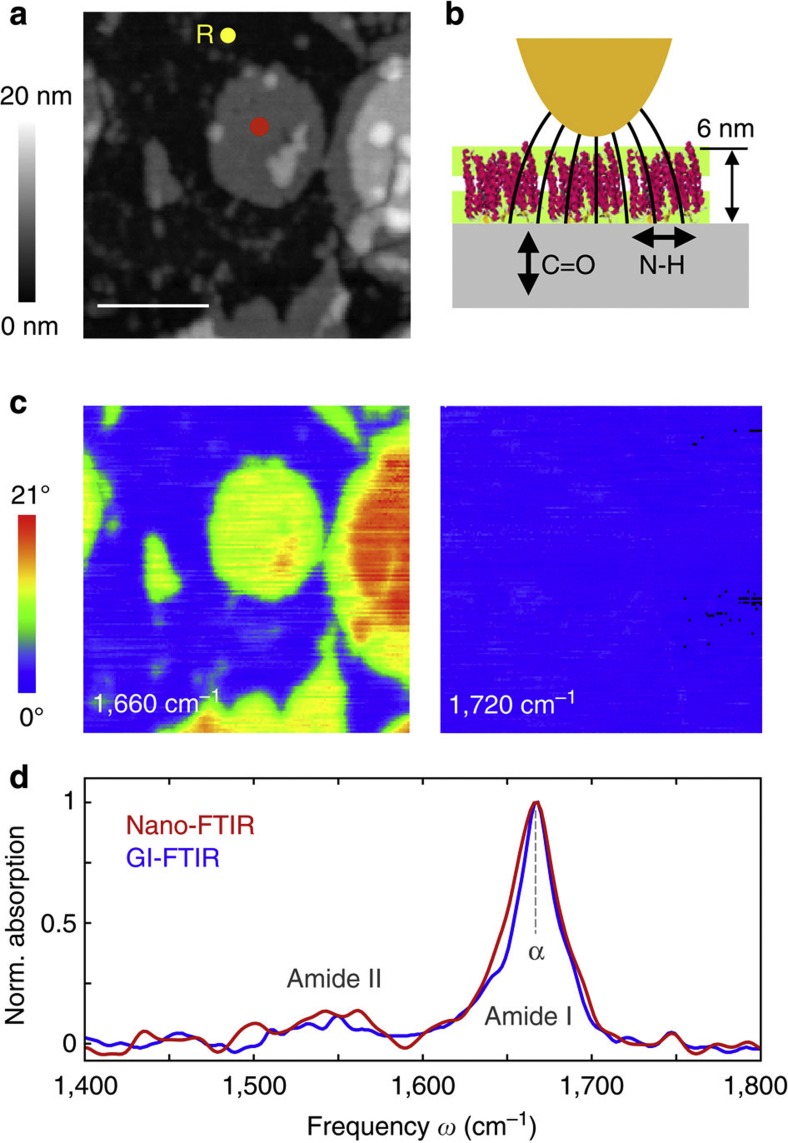
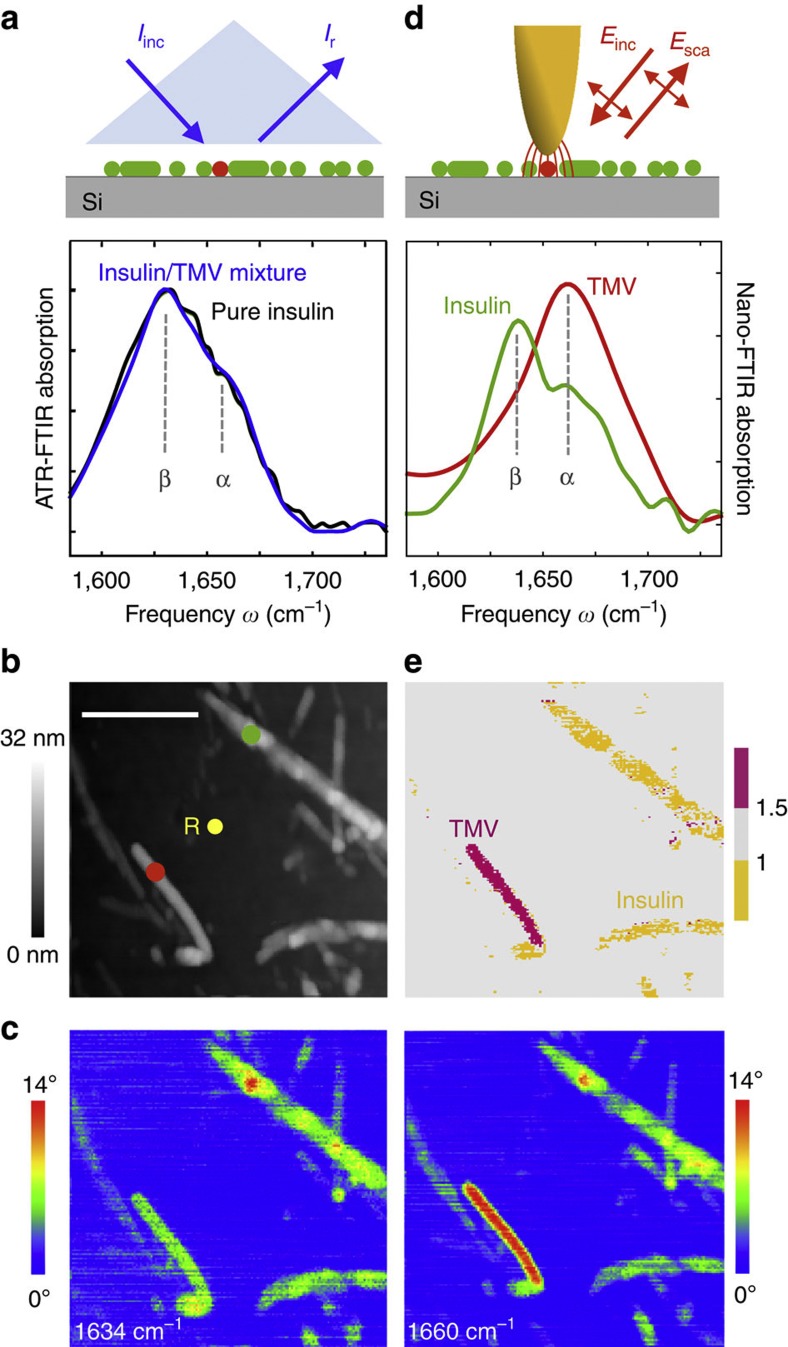
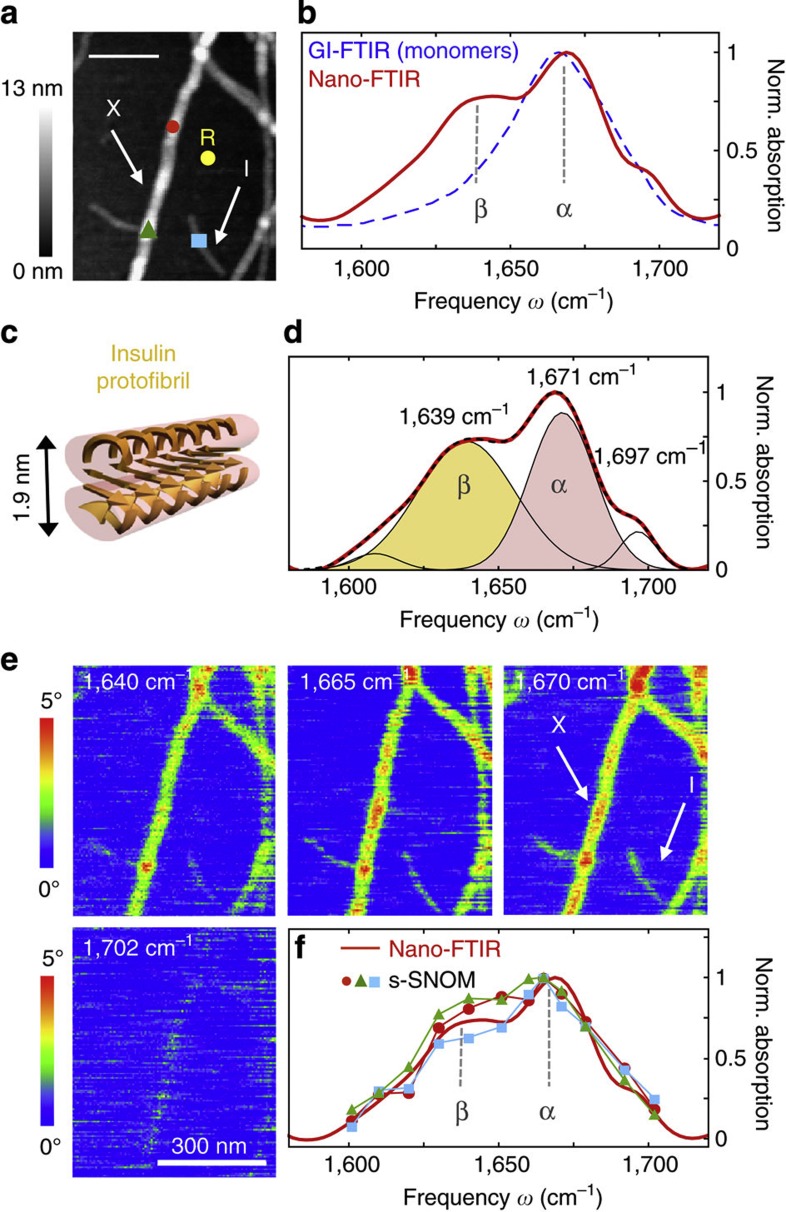
Mid-infrared spectroscopy is a widely used tool for material identification and secondary structure analysis in chemistry, biology and biochemistry. However, the diffraction limit prevents nanoscale protein studies. Here we introduce mapping of protein structure with 30 nm lateral resolution and sensitivity to individual protein complexes by Fourier transform infrared nanospectroscopy (nano-FTIR). We present local broadband spectra of one virus, ferritin complexes, purple membranes and insulin aggregates, which can be interpreted in terms of their α-helical and/or β-sheet structure. Applying nano-FTIR for studying insulin fibrils--a model system widely used in neurodegenerative disease research--we find clear evidence that 3-nm-thin amyloid-like fibrils contain a large amount of α-helical structure. This reveals the surprisingly high level of protein organization in the fibril's periphery, which might explain why fibrils associate. We envision a wide application potential of nano-FTIR, including cellular receptor in vitro mapping and analysis of proteins within quaternary structures.


Conflict of interest statement

R.H. is co-founder of Neaspec GmbH, a company producing scattering-type scanning near-field optical microscope systems, such as the one used in this study. The remaining authors declare no competing financial interests.

Figures

Figure 1
Figure 1. Infrared spectroscopy of protein nanostructures.
(a) s-SNOM and nano-FTIR set-up employing a tunable single line laser (quantum cascade laser, QCL) or a mid-infrared continuum source (fibre laser plus difference frequency generator) for tip illumination, respectively. The illumination can be chosen with a flip mirror (FM). The light backscattered from the tip is analysed with a Michelson interferometer that is operated in either pseudoheterodyne mode (for s-SNOM imaging) or as a Fourier transform spectrometer (for nano-FTIR spectroscopy). It comprises a beam splitter (BS, uncoated ZnSe), a reference mirror (RM) and a detector. (b) Schematics of s-SNOM and nano-FTIR spectroscopy. (c) Schematics of far-field GI-FTIR spectroscopy of protein nanostructure ensembles.
Figure 2
Figure 2. Infrared nanospectroscopy of TMV and individual ferritin protein complexes.
(a) Illustration of the protein structure of TMV. (b) Topography of TMV on a silicon substrate. Scale bar, 100 nm. (c) Infrared near-field phase images ϕ3 at two different frequencies, 1,660 cm−1 (left) and 1,720 cm−1 (right; 2.5 min total image acquisition time). (d) Nano-FTIR spectrum of TMV taken at the position marked by the red dot in the topography image (red, average of 40 interferograms; 22 min total acquisition time; 8 cm−1 resolution; × 4 zero filling) and a GI-FTIR spectra of a large TMV ensemble on a gold substrate (blue). (e) Illustration of the protein structure of ferritin. (f) Illustration of the tip probing a ferritin particle. The graph shows the measured height profile h when the tip is scanned along the dashed line in Fig. 2g. (g) Topography and infrared near-field image ϕ3 of two ferritin molecules and a ferrihydrite core on a silicon substrate. Scale bar, 50 nm (1.5 min total image acquisition time). (h) Nano-FTIR (red) and GI-FTIR spectra of a large ferritin ensemble on a gold substrate (blue). The red dot in the topography image marks the position where the nano-FTIR spectra (average of 60 interferograms; 23 min total acquisition time; 8 cm−1 resolution; × 4 zero filling) was recorded. The position marked by the yellow dot and R in b and g indicates where the reference spectrum was recorded.
Figure 3
Figure 3. Nano-FTIR sensitivity to protein orientation demonstrated with PM.
(a) Topography of PMs on a silicon substrate. Scale bar, 400 nm. (b) Illustration of near-field probing of PM. (c) Infrared near-field phase images ϕ3 at two different frequencies, 1,660 cm−1 (left) and 1,720 cm−1 (right; 19 min total image acquisition time). (d) Nano-FTIR (red) and GI-FTIR spectra of an ensemble of horizontally absorbed PMs on a gold substrate (blue). The red dot in the topography image marks the position where the nano-FTIR spectra (average of 60 interferograms; 23 min total acquisition time; 8 cm−1 resolution; × 4 zero filling) was recorded. The position marked by the yellow dot and R indicates where the reference spectrum was recorded.
Figure 4
Figure 4. Nano-FTIR mapping of PM.
(a) Topography image of PM on a silicon substrate. Scale bar, 100 nm. (b) Infrared spectroscopic line scan recorded while the tip was scanned in 10 nm steps along the line of red and blue dots in a. At the position of each dot, a spectrum was taken (each spectrum is an average of 17 interferograms; 2.3 min acquisition time; 16 cm−1 resolution; × 6 zero filling). (c) Absorption signal a3 at 1,660 cm1 as a function of position x. (d) Twenty nano-FTIR spectra recorded at the positions P1–P20 marked by red and blue dots in a. The spectra are the same as those presented in b. For better visibility, each spectrum is vertically offset. All spectra have been normalized to the reference spectrum recorded at the position marked by the yellow dot and R in a.
Figure 5
Figure 5. Nanoscale mapping of α-helical and β-sheet secondary structure.
(a) ATR-FTIR spectrum of a pure insulin aggregate sample (black) and a mixture of insulin aggregates and TMV (blue) on a silicon support. (b) Topography of a mixture of TMV and insulin aggregates on silicon. Scale bar, 500 nm. (c) Infrared near-field phase images ϕ3 at two different frequencies, 1,634 cm−1 (left) and 1,660 cm−1 (right; 19 min total image acquisition time). (d) Nano-FTIR spectra of TMV (red, average of 70 interferograms; 19 min total acquisition time; 16 cm−1 resolution; × 4 zero filling) and insulin aggregate (green, average of 40 interferograms; 22 min total acquisition time; 8 cm−1 resolution × 4 zero filling). Red and green dots in the topography image mark the positions where the nano-FTIR spectra were taken. The position marked by the yellow dot and R indicates where the reference spectrum was recorded. (e) Map of TMV (purple) and insulin (yellow) aggregates.
Figure 6
Figure 6. Infrared nanospectroscopy and nanoimaging of secondary structure in individual insulin fibrils.
(a) Topography of insulin fibrils on a silicon substrate. Scale bar, 200 nm. The arrows indicate a type I fibril (I) and a 9-nm-thick fibril composed of several protofilaments (X), respectively. (b) Nano-FTIR spectrum of a 9-nm-thick insulin fibril (red, average of 154 interferograms; 8 cm−1 resolution; × 4 zero filling) recorded at the position marked by the red symbol in a. The position marked by the yellow dot and R indicates where the reference spectrum was recorded. The dashed blue line shows for comparison a GI-FTIR spectrum of insulin monomers on a gold substrate. (c) Illustration of the structure of an amyloid-like insulin protofibril (a type I fibril consists of two protofibrils). (d) Band decomposition of the nano-FTIR spectrum (red curve) based on five absorption bands (thin black curves). The dashed black curve shows the resulting fit. (e) s-SNOM phase images of the fibrils shown in a. Scale bar, 300 nm. (f) Local infrared absorption spectra (symbols) depicting the normalized imaginary part of the near-field signal at the positions marked in a. The data points were extracted from 12 near-field amplitude and phase images and were normalized to the imaginary part of the near-field signal on the silicon substrate. Four of the phase images are shown in e. For comparison, the nano-FTIR spectrum of b is depicted by the red thick curve. All spectra are normalized to their maximum value.

References

    1. Venyaminov S. Y. & Kalnin N. N. Quantitative IR spectrophotometry of peptide compounds in water (H2O) solutions. I. Spectral parameters of amino-acid residue absorption-bands. Biopolymers 30, 1243–1257 (1990). - PubMed
    1. Jackson M. & Mantsch H. H. The use and misuse of FTIR spectroscopy in the determination of protein-structure. Crit. Rev. Biochem. Mol. Biol. 30, 95–120 (1995). - PubMed
    1. Garczarek F. & Gerwert K. Functional waters in intraprotein proton transfer monitored by FTIR difference spectroscopy. Nature 439, 109–112 (2006). - PubMed
    1. Ataka K., Kottke T. & Heberle J. Thinner, smaller, faster: IR techniques to probe the functionality of biological and biomimetic systems. Angew. Chem Int. Ed. 49, 5416–5424 (2010). - PubMed
    1. Gupta S. C. et al. Multitargeting by curcumin as revealed by molecular interaction studies. Natural Product Reports 28, 1937–1955 (2011). - PMC - PubMed

Publication types

MeSH terms