Comparative Study
. 2014 Apr 15;23(8):2164-75.
doi: 10.1093/hmg/ddt613. Epub 2013 Dec 2.

Hsp90 inhibition protects against inherited retinal degeneration

Affiliations
Comparative Study

Hsp90 inhibition protects against inherited retinal degeneration

Mònica Aguilà et al. Hum Mol Genet. .

Abstract

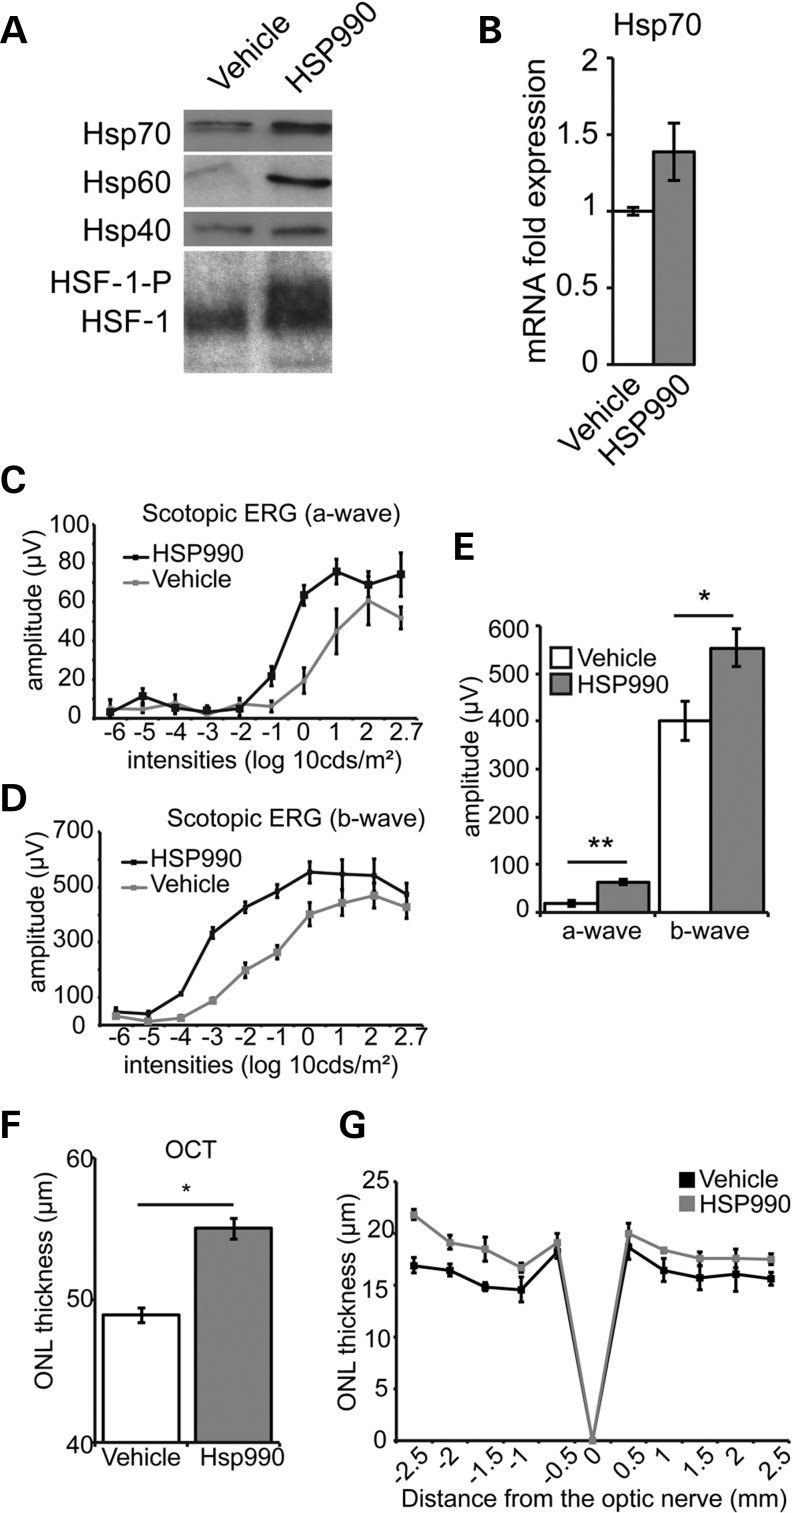
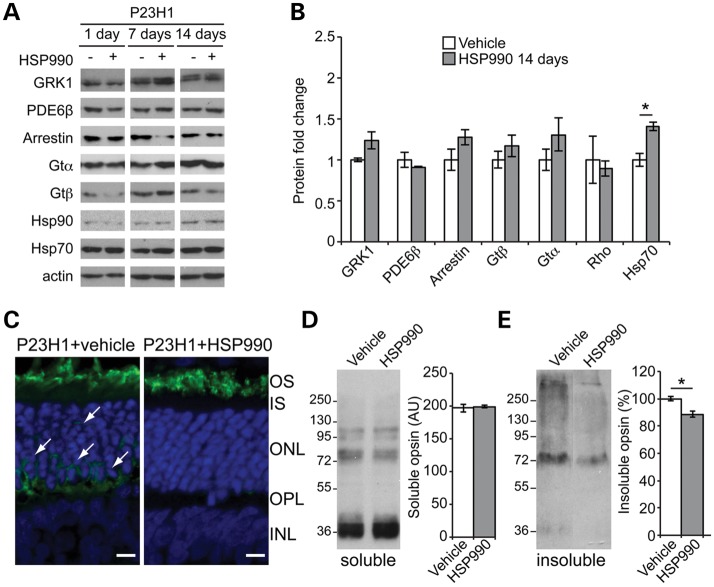
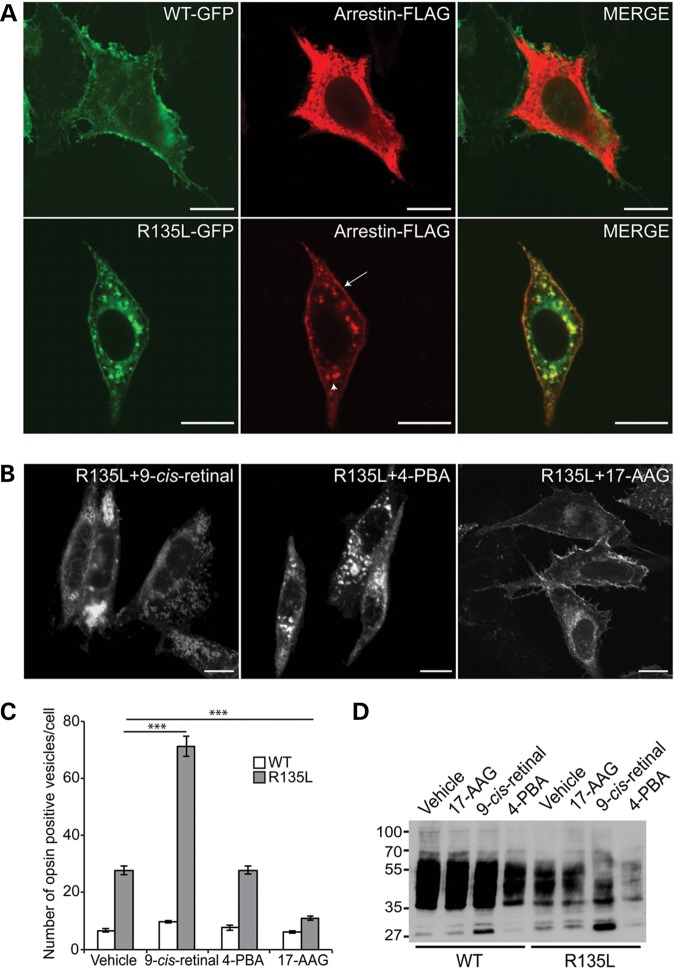
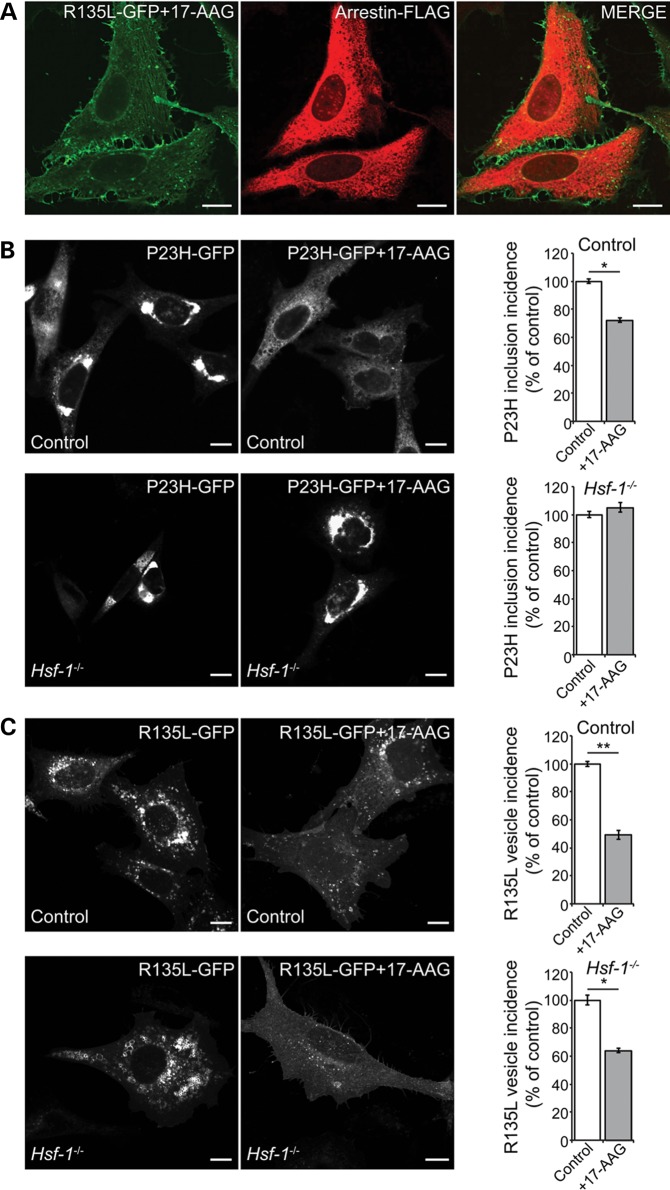
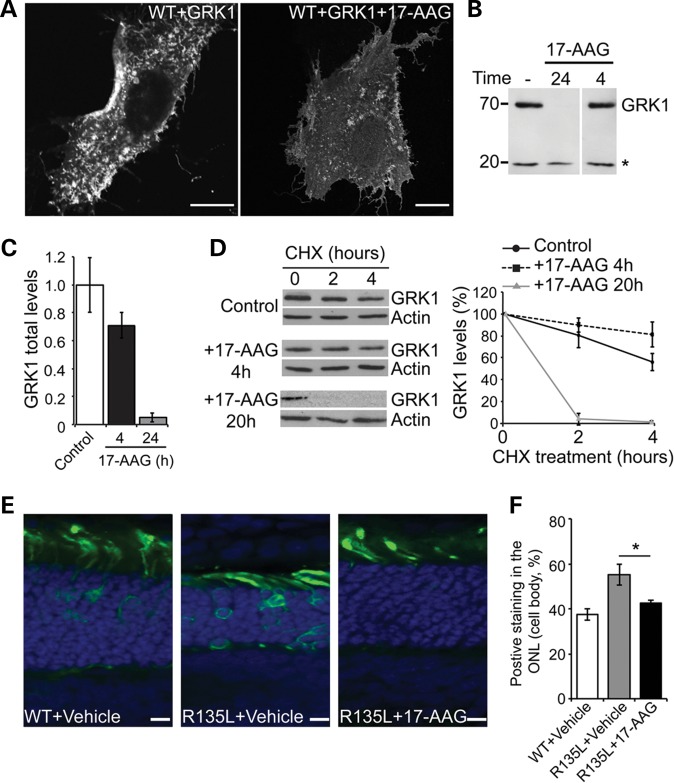
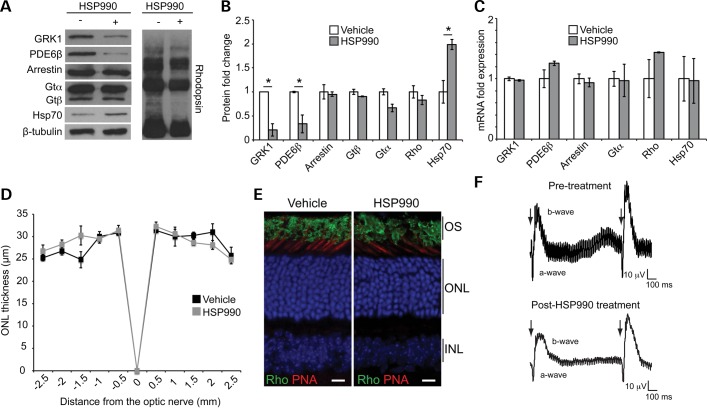
The molecular chaperone Hsp90 is important for the functional maturation of many client proteins, and inhibitors are in clinical trials for multiple indications in cancer. Hsp90 inhibition activates the heat shock response and can improve viability in a cell model of the P23H misfolding mutation in rhodopsin that causes autosomal dominant retinitis pigmentosa (adRP). Here, we show that a single low dose of the Hsp90 inhibitor HSP990 enhanced visual function and delayed photoreceptor degeneration in a P23H transgenic rat model. This was associated with the induction of heat shock protein expression and reduced rhodopsin aggregation. We then investigated the effect of Hsp90 inhibition on a different type of rod opsin mutant, R135L, which is hyperphosphorylated, binds arrestin and disrupts vesicular traffic. Hsp90 inhibition with 17-AAG reduced the intracellular accumulation of R135L and abolished arrestin binding in cells. Hsf-1(-/-) cells revealed that the effect of 17-AAG on P23H aggregation was dependent on HSF-1, whereas the effect on R135L was HSF-1 independent. Instead, the effect on R135L was mediated by a requirement of Hsp90 for rhodopsin kinase (GRK1) maturation and function. Importantly, Hsp90 inhibition restored R135L rod opsin localization to wild-type (WT) phenotype in vivo in rat retina. Prolonged Hsp90 inhibition with HSP990 in vivo led to a posttranslational reduction in GRK1 and phosphodiesterase (PDE6) protein levels, identifying them as Hsp90 clients. These data suggest that Hsp90 represents a potential therapeutic target for different types of rhodopsin adRP through distinct mechanisms, but also indicate that sustained Hsp90 inhibition might adversely affect visual function.


Figures

Figure 1.
Figure 1.
HSP990 protects photoreceptor function and survival in P23H-1 rats. (A) Western blots of the HSR in mouse retina systemically treated with HSP990 (20 mg/kg) or vehicle. Retinae were collected 24 h postadministration and 10 μg total protein western blotted for Hsp70, Hsp60 or Hsp40, as indicated. For the western blot for HSF-1, retinae were harvested 2 h after HSP990 (20 mg/kg) or vehicle administration. Posttranslational modification of HSF-1 such as phosphorylation is indicated (HSF-1-P). (B) RT–PCR showing retinal Hsp70 mRNA induction 2 h after HSP990 administration. Scotopic ERG responses, a-wave (C), b-wave (D) and average at 1 log 10 cds/m2, (E) in vehicle or HSP990-treated P23H-1 rats at P35, following a single-dose HSP990 treatment at P21. *P ≤ 0.05, values are means ± SEM, n ≥ 5 (F) P23H-1 ONL thickness at P35 after a single dose of HSP990 at P21 assessed by OCT measurements. *P ≤ 0.05, values are means ± SEM, n ≥ 4. (G) Spider plot of ONL thickness in vehicle and HSP990-treated animals at P35 following a single treatment at 21 days old. *P ≤ 0.05, values are mean ± SEM (n ≥ 5 per treatment group).
Figure 2.
Figure 2.
HSR induction and reduced aggregation in the P23H-1 rat retina following HSP990 treatment. (A) Western blots of P23H-1 rat retinae treated with a single dose of vehicle or HSP990 at 21 days of age after 1, 7 or 14 days, as indicated. (B) Quantification of expression levels of phototransduction proteins and Hsp70 in P23H-1 rat retina relative to levels of actin, 14 days after HSP990 administration. Western blots were subjected to densitometric analyses. Fold expression of each protein was calculated for HSP990 relative to vehicle. *P ≤ 0.05, values are means ± SEM, n ≥ 3. (C) Representative images of ONL from HSP990 or vehicle-treated P23H-1 animals with rhodopsin stained in green and nuclei in blue with DAPI. Cell body staining is arrowed. Scale bars: 10 μm. Representative western blots and densitometric quantitation of soluble (D) and insoluble (E) rhodopsin fractions revealed a reduction only in the insoluble fraction following HSP990 treatment. The position of molecular-weight markers is indicated on the left in kDa for the blots. *P < 0.05, ANOVA values are mean ± SEM (n ≥ 3 per treatment group).
Figure 3.
Figure 3.
Pharmacological manipulation of R135L rhodopsin. (A) Subcellular distribution and trafficking of WT-GFP and R135L-GFP rod opsin (green) in SK-N-SH neuroblastoma cells co-transfected with visual arrestin-FLAG (red). WT rod opsin mainly decorated the PM and visual arrestin remained in the cytoplasm. R135L rod opsin mutant recruited and translocated cytosolic visual arrestin to the PM (arrow) and the endocytic compartments (arrowhead). Scale bars: 10 μm. (B) Fluorescence microscopy of R135L-GFP rod opsin and treated with 10 μm 9-cis-retinal, 10 mm 4-PBA and 1 μm 17-AAG. Scale bars: 10 μm. (C) Cell counts of intracellular vesicle incidence in cells expressing WT-GFP (open) or R135L-GFP (grey) following treatment with 9-cis-retinal, 4-PBA or 17-AAG for 18 h. Values are mean ± SEM. ***P < 0.0001, Student's t-test n = 3. (D) Western blot with 1D4 of untagged WT and R135L rod opsin after treatment with 9-cis-retinal, 4-PBA or 17-AAG for 24 h. The position of molecular-weight markers is indicated on the left in kDa.
Figure 4.
Figure 4.
Hsp90 inhibition affects P23H and R135L by different mechanisms. (A) Subcellular distribution and trafficking of rod opsin in SK-N-SH cells co-transfected with R135L-GFP rod opsin (green) and arrestin-FLAG (red) and treated with 17-AAG (1 μm) for 24 h. (B) Representative images of P23H-GFP expressing control (upper panels) and Hsf-1−/− MEFs (lower panels) treated with vehicle or 17-AAG (0.5 μm) for 20 h as indicated (left panels). At least 600 cells were scored for the presence of inclusions in each condition and the inclusion incidence was normalized to vehicle-treated inclusion incidence (right panels). Values are mean ± SEM. *P < 0.05, Student’s t-test. (C) Representative images of R135L-GFP expressing control (upper panels) and Hsf-1−/− MEFs (lower panels) treated with vehicle or 17-AAG (0.5 μm) for 20 h, as indicated (left panels). Cells were scored for large intracellular accumulations of R135L-positive vesicles and the values normalized to vehicle-treated MEFs (right panels). At least 600 cells were scored in each condition. Values are mean ± SEM. *P < 0.05, **P < 0.01, Student’s t-test. Scale bars: 10 μm.
Figure 5.
Figure 5.
Hsp90 inhibition blocks R135L:arrestin recruitment through GRK1 (A) SK-N-SH cells co-transfected with WT-GFP rod opsin and FLAG-GRK1 and treated with 17-AAG (1 μm) or vehicle for 24 h. Scale bars: 10 μm. (B) Western blot of FLAG-GRK1 expression following 17-AAG treatment. SK-N-SH cells were transfected with FLAG-GRK1 and treated with 17-AAG (1 μm) for 24 or 4 h as indicated. Ten micrograms of soluble protein were resolved and detected using anti-FLAG mAb. Asterisk highlights a non-specific band used as a loading control. (C) Quantification of total FLAG-GRK1 levels, normalized relative to loading control, after incubation with 17-AAG for the indicated times. Values are mean ± SEM (n > 6). (D) Degradation of GRK1 in the presence of 17-AAG. Left panel, western blot for FLAG-GRK1 and actin of SK-N-SH cell lysates treated with 17-AAG for the indicated times prior to addition of CHX (50 μg/ml) for the indicated times. Exposures have been adjusted so that time 0 is approximately equivalent. Right panel shows quantification of GRK1 levels normalized to time 0. Values are mean ± SEM (n ≥ 3). (E) In vivo electroporation of WT and R135L rod opsin. WT-GFP or R135-GFP (green), as indicated, was injected subretinally with vehicle or 17-AAG (20 mg/ml) and electroporated in neonatal SD rats. Eyes were analyzed 16 days postelectroporation. Nuclei were stained with DAPI. Scale bars: 10 μm. (F) Quantitation of over 100 transfected cells (n = 4) showed WT-GFP was mainly present in the ROS, whereas R135L-GFP in the presence of vehicle was observed throughout the photoreceptor cell layer. Treatment with 17-AAG partially shifted the mutant protein to the ROS and reduced cell body staining. * P < 0.05, Student's t-test.
Figure 6.
Figure 6.
Systemic administration of HSP990 reduces GRK1 and PDE6 levels. (A) Western blots of 10 μg total retina protein for phototransduction proteins or Hsp70 from mice treated once every 3 days with HSP990 (80 mg/kg) for 10 days. (B) Expression levels of phototransduction proteins and Hsp70 in mouse retina normalized to β-tubulin. Fold expression of each protein was calculated following HSP990 treatment relative to vehicle. Values are mean ± SEM (n ≥ 3 per treatment group). *P < 0.05, Student's t-test. (C) RT–PCR of retinal cDNA to determine the fold induction of phototransduction and Hsp70 (HSPA1) genes following 10 days of HSP990 (80 mg/kg) treatment relative to expression of the vehicle-treated mice. Values are mean fold ± SEM (n ≥ 3 per treatment group). *P < 0.05, Student's t-test. (D) Spider plot showing ONL thickness of vehicle or HSP990 (80 mg/kg)-treated mice once every 3 days for 10 days. Values are mean ± SEM (n ≥ 3 per treatment group). (E) Retinal sections stained for rhodopsin with 1D4 antibody (green), cone OS with PNA (red) and DAPI to visualize nuclei (blue) showed rhodopsin localization in the ROS in both vehicle and HSP990-treated conditions. (F) Double-flash ERGs of mice pre- and post-HSP990 treatment. Recovery of the a- and b-waves was analyzed by delivering a double flash at different interval stimulus illumination (ISI). The traces displayed correspond to ISI(s) = 1 and show a good recovery of the a- and b-wave following HSP990 treatment. A representative trace of one animal is shown per treatment (n = 3 per treatment group).

Similar articles

Cited by

References

    1. Taipale M., Jarosz D.F., Lindquist S. HSP90 at the hub of protein homeostasis: emerging mechanistic insights. Nat. Rev. Mol. Cell Biol. 2010;11:515–528. - PubMed
    1. Li J., Buchner J. Structure, function and regulation of the hsp90 machinery. Biomed. J. 2013;36:106–117. - PubMed
    1. Pearl L.H., Prodromou C., Workman P. The Hsp90 molecular chaperone: an open and shut case for treatment. Biochem. J. 2008;410:439–453. - PubMed
    1. Walton-Diaz A., Khan S., Bourboulia D., Trepel J.B., Neckers L., Mollapour M. Contributions of co-chaperones and post-translational modifications towards Hsp90 drug sensitivity. Future Med. Chem. 2013;5:1059–1071. - PMC - PubMed
    1. Zou J., Guo Y., Guettouche T., Smith D.F., Voellmy R. Repression of heat shock transcription factor HSF1 activation by HSP90 (HSP90 complex) that forms a stress-sensitive complex with HSF1. Cell. 1998;94:471–480. - PubMed

Publication types

MeSH terms

Substances