. 2013 Dec 3:9:711.
doi: 10.1038/msb.2013.68.

Timescales and bottlenecks in miRNA-dependent gene regulation

Affiliations

Timescales and bottlenecks in miRNA-dependent gene regulation

Jean Hausser et al. Mol Syst Biol. .

Abstract

MiRNAs are post-transcriptional regulators that contribute to the establishment and maintenance of gene expression patterns. Although their biogenesis and decay appear to be under complex control, the implications of miRNA expression dynamics for the processes that they regulate are not well understood. We derived a mathematical model of miRNA-mediated gene regulation, inferred its parameters from experimental data sets, and found that the model describes well time-dependent changes in mRNA, protein and ribosome density levels measured upon miRNA transfection and induction. The inferred parameters indicate that the timescale of miRNA-dependent regulation is slower than initially thought. Delays in miRNA loading into Argonaute proteins and the slow decay of proteins relative to mRNAs can explain the typically small changes in protein levels observed upon miRNA transfection. For miRNAs to regulate protein expression on the timescale of a day, as miRNAs involved in cell-cycle regulation do, accelerated miRNA turnover is necessary.


Conflict of interest statement

The authors declare that they have no conflict of interest.

Figures

Figure 1
Figure 1
The amount of siRNA-loaded Ago following siRNA micro-injection can be modeled by a bi-exponential function. (A) Cartoon illustrating the model parameters: at time t=0, X0 siRNAs are injected into the cell, after which the siRNAs X either decay with rate d or load into a free Ago f0F with rate b to form siRNA-loaded Ago complexes A. Small RNAs dissociate from Ago at rate u. (B) Measured (dots) and fitted (lines) fractions of complexed Ago and complexed siRNAs from the data set of Ohrt et al (2008). Error bars represent the 95% confidence interval on the mean measured fraction of Ago and siRNA in complex. Maximum-likelihood parameter estimates also appear in the figure. γ=bf0 is the Ago–siRNA association rate b normalized to the fraction of free Ago f0. See also Supplementary Figure S1.
Figure 2
Figure 2
Changes in mRNA levels in the miR-124 transfection time course of Wang and Wang (2006) can be modeled assuming a tri-exponential Ago-loading function. (A) Cartoon illustrating two models of miRNA transfection experiments and their parameters. Free, fitted parameters appear in black, fixed parameters from Figure 1 in gray. The bi-exponential model (in green) is the same as in Figure 1A. Also shown is a tri-exponential model of Ago loading (in red), which is identical to the bi-exponential model, except for the addition of an extra compartment (V) in which V0 miRNAs are loaded at time t=0, and two additional rates: rate of miRNA decay in this compartment (formula image
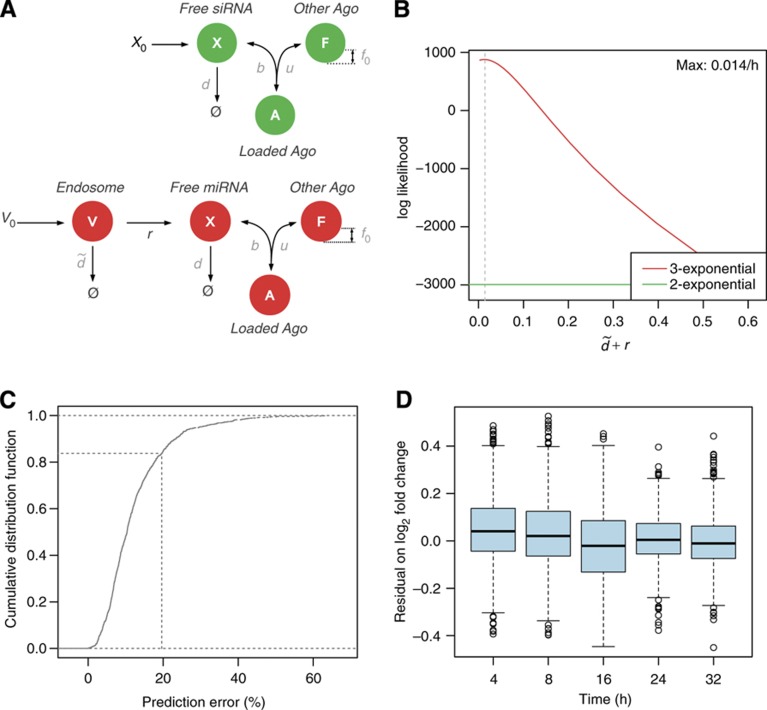
) and rate of transfer to the Ago-accessible environment (r). (B) Log-likelihood profile of the clearance parameter formula image given the mRNA profiling time-course data. The log-likelihood of the tri-exponential model (red line) is compared with that of the bi-exponential model (green line). (C) Cumulative distribution of the per-gene relative error between the model and the time-course data. The x-axis represents the per-gene relative error between the model prediction and the measurements. For any chosen cutoff on the relative error, the fraction of genes whose regulation following miRNA transfection could be predicted at the chosen error cutoff or less can be read on the y-axis. The dotted line marks a 20% error on the fold change typically observed in miRNA transfection experiments. (D) Boxplots of the model residual on log2 fold changes for genes that fit the measured mRNA fold changes with less than a 20% error. Boxes span the interquartal range and whiskers extending up to 1.5 times the interquartal range. See also Supplementary Figure S2.
Figure 3
Figure 3
The kinetic model fits measured changes in mRNA and protein levels following miR-199a transfection (A) or induction (B) in HEK293 cells. The 3′ UTR of the KTN1 miR-199a target was cloned downstream of the stop codon of a luciferase reporter gene. Changes in mRNA expression following miR-199a transfection or induction were quantified by qPCR whereas changes in protein levels were determined by measuring luciferase activity. In the transfection experiment, changes in mRNA and protein levels were then fitted assuming the previously introduced three-exponential Ago-loading model. In the induction experiment, we assumed constant miRNA synthesis into an Ago-accessible environment. The best-fitted model appears as a continuous line and error bars represent 95% confidence intervals on the measured changes in mRNA and protein abundance. See also Supplementary Figure S3.
Figure 4
Figure 4
The kinetic model explains temporal changes in mRNA abundance, protein abundance and translation efficiency of most miRNA targets. Cumulative distributions of the relative error between the model prediction and the measurements in different transfection experiments. (A) Ribosome Protected Fragment (RPF) sequencing and mRNAseq experiments upon transfection of miR-155 and miR-1 by Guo et al (2010). (B) SILAC and microarray experiments upon miRNA transfection of miR-124, miR-1 and miR-181a by Baek et al (2008). (C) pSILAC and microarray experiments following the transfection of let-7b, miR-155, miR-16, miR-1 and miR-30a by Selbach et al (2008). The x-axis of each panel represents the per-gene relative error between the model prediction and the measurements. For any chosen cutoff on the relative error, the fraction of genes whose regulation following miRNA transfection could be predicted at the chosen error cutoff or less can be read on the y-axis. The dotted, vertical bars mark a 20% error cutoff on the fold change. This error level is typically observed in miRNA transfection experiments. See also Supplementary Figure S4.
Figure 5
Figure 5
Parameter ranges that are compatible with a specific dynamic of protein targets. (A) Changes in protein levels induced by a miRNA whose synthesis switches between half-induction and full induction in 24 h cycles. Simulations were performed assuming the default kinetic parameter (48 h protein half-life, miRNA loading and decay rates estimated from biophysics data, red line) or faster kinetics (30 min protein half-life, 14-fold speed-up in miRNA loading and decay, black line). (B) Amplitude (fold change) of the oscillations in protein abundance as a function of protein decay and miRNA kinetics. The color bars correspond to the case where miRNA only affect mRNA decay (λ=0) or equally regulate mRNA decay and translation (λ=1). (C) Changes in protein levels following a sudden drop in miRNA synthesis given default kinetic parameter (48 h protein half-life, miRNA loading and decay rates from biophysics data, red line) or faster kinetics (5 h protein half-life, three-fold speed-up in miRNA loading and decay, black line). (D) Protein recovery time as a function of protein decay and miRNA kinetics. The color bars correspond to the case where miRNA only affect mRNA decay (λ=0) or equally regulate mRNA decay and translation (λ=1). See also Supplementary Figure S5.

References

    1. Anokye-Danso F, Trivedi CM, Juhr D, Gupta M, Cui Z, Tian Y, Zhang Y, Yang W, Gruber PJ, Epstein JA, Morrisey EE (2011) Highly efficient miRNA-mediated reprogramming of mouse and human somatic cells to pluripotency. Cell Stem Cell 8: 376–388 - PMC - PubMed
    1. Baek D, Villén J, Shin C, Camargo F, Gygi S, Bartel DP (2008) The impact of microRNAs on protein output. Nature 455: 64–71 - PMC - PubMed
    1. Bail S, Swerdel M, Liu H, Jiao X, Goff LA, Hart RP, Kiledjian M (2010) Differential regulation of microRNA stability. RNA (New York, NY) 16: 1032–1039 - PMC - PubMed
    1. Bartel DP (2009) MicroRNAs: target recognition and regulatory functions. Cell 136: 215–233 - PMC - PubMed
    1. Béthune J, Artus-Revel CG, Filipowicz W (2012) Kinetic analysis reveals successive steps leading to miRNA-mediated silencing in mammalian cells. EMBO Rep 13: 1–8 - PMC - PubMed

Publication types

LinkOut - more resources