. 2014 Jan 15;306(2):E197-209.
doi: 10.1152/ajpendo.00202.2013. Epub 2013 Dec 3.

Suppression of the mTORC1/STAT3/Notch1 pathway by activated AMPK prevents hepatic insulin resistance induced by excess amino acids

Affiliations

Suppression of the mTORC1/STAT3/Notch1 pathway by activated AMPK prevents hepatic insulin resistance induced by excess amino acids

Hongliang Li et al. Am J Physiol Endocrinol Metab. .

Erratum in

  • Corrigendum.
    [No authors listed] [No authors listed] Am J Physiol Endocrinol Metab. 2016 Nov 1;311(5):E899. doi: 10.1152/ajpendo.zh1-7676-corr.2016. Am J Physiol Endocrinol Metab. 2016. PMID: 27888188 Free PMC article. No abstract available.

Retraction in

Abstract

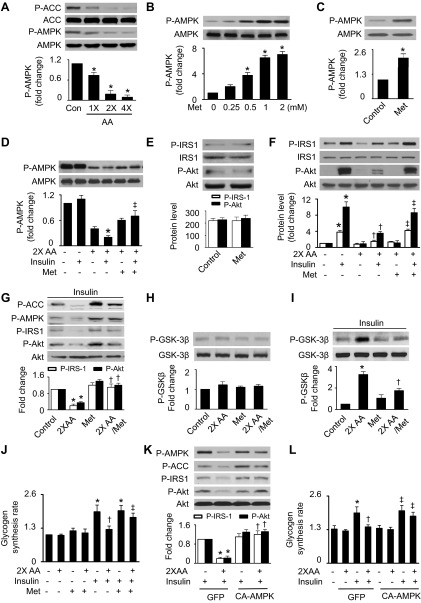
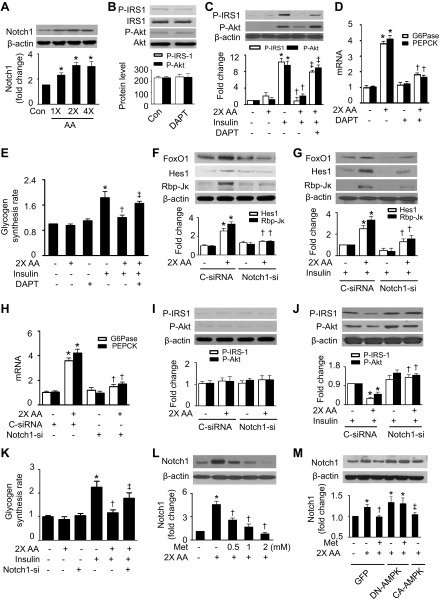
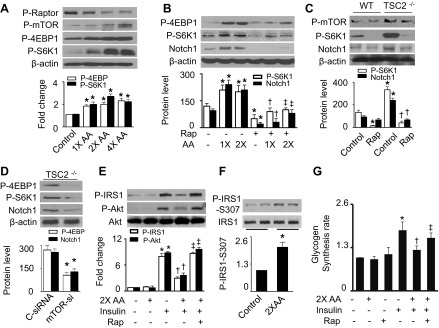
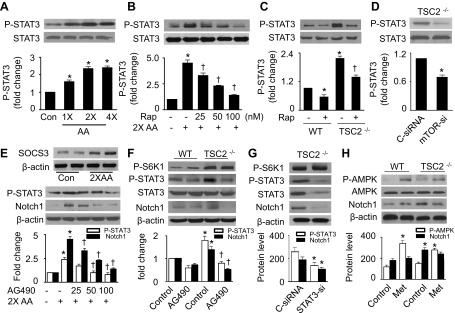
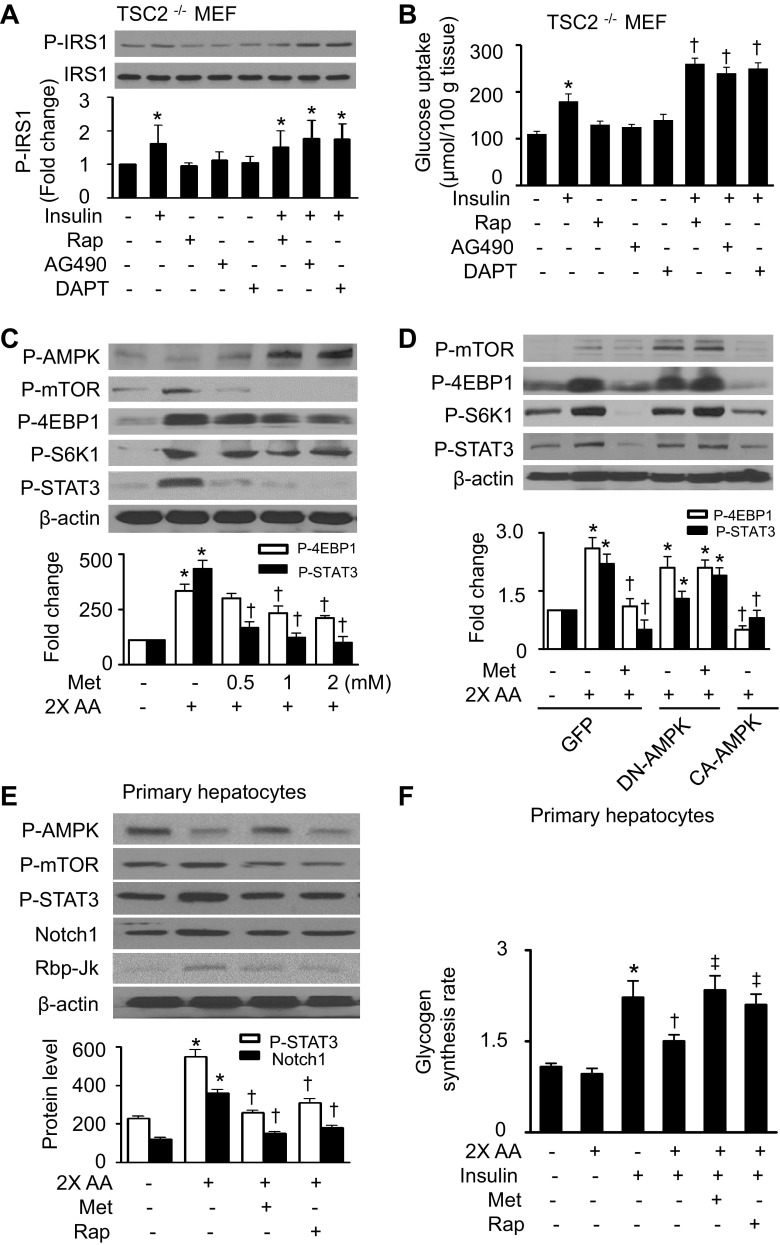
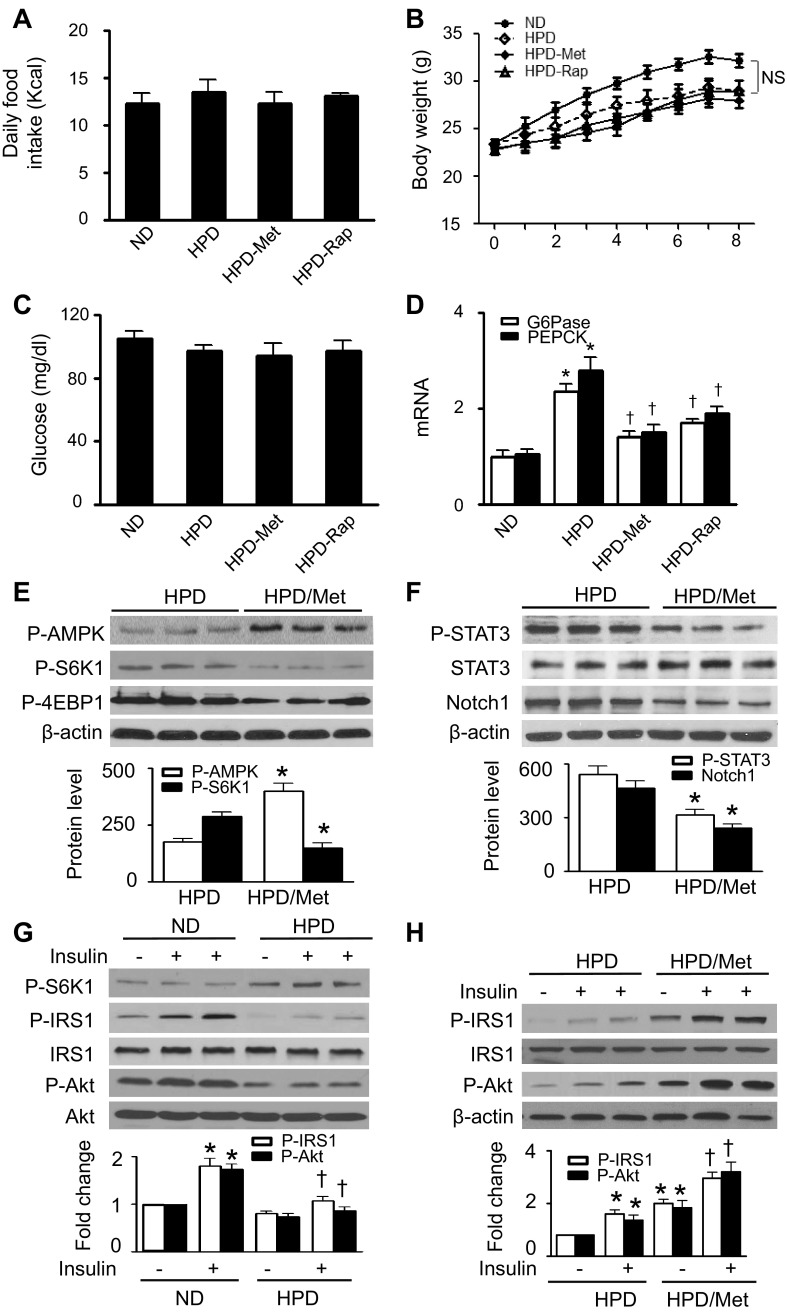
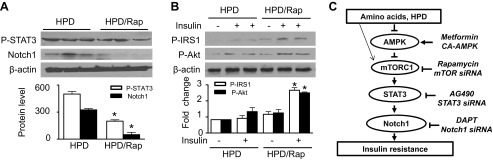
Nutrient overload is associated with the development of obesity, insulin resistance, and type 2 diabetes. However, the underlying mechanisms for developing insulin resistance in the presence of excess nutrients are incompletely understood. We investigated whether activation of AMP-activated protein kinase (AMPK) prevents the hepatic insulin resistance that is induced by the consumption of a high-protein diet (HPD) and the presence of excess amino acids. Exposure of HepG2 cells to excess amino acids reduced AMPK phosphorylation, upregulated Notch1 expression, and impaired the insulin-stimulated phosphorylation of Akt Ser(473) and insulin receptor substrate-1 (IRS-1) Tyr(612). Inhibition of Notch1 prevented amino acid-induced insulin resistance, which was accompanied by reduced expression of Rbp-Jk, hairy and enhancer of split-1, and forkhead box O1. Mechanistically, mTORC1 signaling was activated by excess amino acids, which then positively regulated Notch1 expression through the activation of the signal transducer and activator of transcription 3 (STAT3). Activation of AMPK by metformin inhibited mTORC1-STAT3 signaling, thereby preventing excess amino acid-impaired insulin signaling. Finally, HPD feeding suppressed AMPK activity, activated mTORC1/STAT3/Notch1 signaling, and induced insulin resistance. Chronic administration of either metformin or rapamycin inhibited the HPD-activated mTORC1/STAT3/Notch1 signaling pathway and prevented hepatic insulin resistance. We conclude that the upregulation of Notch1 expression by hyperactive mTORC1 signaling is an essential event in the development of hepatic insulin resistance in the presence of excess amino acids. Activation of AMPK prevents amino acid-induced insulin resistance through the suppression of the mTORC1/STAT3/Notch1 signaling pathway.

Keywords: AMP-activated protein kinase; Notch; amino acids; insulin resistance; mammalian target of rapamycin complex 1; signal transducer and activator of transcription 3.


Figures

Fig. 1.
Fig. 1.
Activation of AMP-activated protein kinase (AMPK) attenuates excess amino acid (AA)-induced insulin resistance in HepG2 cells. A: HepG2 cells subjected to serum and AA starvation were treated with indicated concentrations of AA for 1 h. Phosphorylation of AMPK (Thr172) and acetyl-CoA carboxylase (ACC; Ser79) was analyzed by Western blot (WB) (*P < 0.05 vs. control; n = 6). B: cells were treated with the indicated concentrations of metformin (Met) for 1 h in the presence of normal concentrations of AA, and the expression of phosphorylated AMPK (P-AMPK) and total AMPK was assessed by WB (*P < 0.05 vs. control; n = 6). C: the effect of Met (2 mM) on AMPK phosphorylation was determined by WB in the absence of AA (*P < 0.05). D: cells were pretreated with Met (2 mM) for 1 h and then stimulated with insulin (100 nm) for 15 min in the presence or absence of 2× AA. Phosphorylation of AMPK was analyzed by WB (*P < 0.05 vs. control and ‡P < 0.05 vs. 2× AA/insulin; n = 4). E: the effects of Met on phosphorylated insulin receptor substrate-1 (P-IRS-1)-Tyr612 and phosphorylated Akt (P-Akt)-Ser473 were determined by WB. F: insulin-stimulated phosphorylation of IRS-1 and Akt was analyzed by WB (*P < 0.05 vs. control, †P < 0.05 vs. 2× AA, and ‡P < 0.05 vs. 2× AA/insulin; n = 4). G: protein levels of P-AMPK, P-IRS-1, and P-Akt were analyzed by WB (*P < 0.05 vs. control and †P < 0.05 vs. 2× AA; n = 4). H and I: expression of P-GSK-3β (Ser9) were detected by WB (*P < 0.05 vs. control and †P < 0.05 vs. 2× AA; n = 4). J: glycogen synthesis was assayed as described in materials and methods (*P < 0.05 vs. control, †P < 0.05 vs. 2× AA, and ‡P < 0.05 vs. 2× AA/insulin; n = 4). K: the cells transfected with GFP or constitutively active AMPK (CA-AMPK) adenovirus were treated with insulin (100 nM) and 2× AA. Protein levels of P-AMPK, P-IRS-1, and P-Akt were analyzed by WB [*P < 0.05 vs. green fluorescent protein (GFP)/insulin and †P < 0.05 vs. 2× AA/insulin/GFP; n = 4]. L: glycogen synthesis was assayed as described in materials and methods (*P < 0.05 vs. GFP/insulin, †P < 0.05 vs. 2× AA/insulin/GFP, and ‡P < 0.05 vs. 2× AA/insulin; n = 4).
Fig. 2.
Fig. 2.
AMPK suppresses AA-induced insulin resistance through upregulation of Notch1. A: HepG2 cells were treated with the indicated concentrations of AA for 1 h, and expression of Notch1 was analyzed by WB (*P < 0.05 vs. control; n = 5). B: cells were treated with LY-374973, N-[N-(3,5-difluorophenacetyl)-L-alanyl]-S-phenylglycine t-butyl ester (DAPT; 10 μM) for 1 h, and expression of P-IRS-1 and P-Akt was evaluated by WB. C: insulin-stimulated phosphorylation of IRS-1 and Akt was measured by WB (*P < 0.05 vs. control, †P < 0.05 vs. 2× AA, and ‡P < 0.05 vs. 2× AA/insulin; n = 4). D: expression of glucose-6-phosphatase (G6Pase) and phosphoenolpyruvate carboxykinase (PEPCK) mRNA was measured by RT-PCR (*P < 0.05 vs. control and †P < 0.05 vs. 2× AA; n = 4). E: glycogen synthesis was assayed as described in materials and methods (*P < 0.05 vs. control, †P < 0.05 vs. 2× AA, and ‡P < 0.05 vs. 2× AA/insulin; n = 4). F: cells were transfected with control (C-siRNA) or Notch1 siRNA (Notch1-si) and treated with 2× AA, and expression of forkhead box protein O1 (FoxO1), hairy and enhancer of split-1 (Hes1), and Rbp-Jκ was analyzed by WB (*P < 0.05 vs. C-siRNA and †P < 0.05 vs. C-siRNA/2× AA; n = 4). G: cells were transfected with C-siRNA or Notch1-si and treated with 2× AA in the presence of insulin (100 nM), and expression of FoxO1, Hes1, and Rbp-Jκ was analyzed by WB (*P < 0.05 vs. C-siRNA/insulin and †P < 0.05 vs. C-siRNA/2× AA/insulin; n = 4). H: expression of G6Pase and PEPCK mRNA was assayed by RT-PCR (*P < 0.05 vs. C-siRNA and †P < 0.05 vs. C-siRNA/2× AA; n = 4). I and J: insulin-stimulated phosphorylation of IRS-1 and Akt was detected by WB (*P < 0.05 vs. C-siRNA/insulin and †P < 0.05 vs. C-siRNA/2× AA/insulin; n = 4). K: glycogen synthesis was assayed as described in materials and methods (*P < 0.05 vs. control, †P < 0.05 vs. insulin, and ‡P 0.05 vs. 2× AA/insulin; n = 4). L: expression of Notch1 and β-actin was analyzed by WB (*P < 0.05 vs. control and †P < 0.05 vs. 2× AA; n = 5). M: HepG2 cells were infected with adenovirus encoding GFP, dominant-negative AMPK adenoviral vector (DN-AMPK), or CA-AMPK overnight. The cells were then treated with Met and 2× AA for 1 h. Expression of Notch1 was detected by WB (*P < 0.05 vs. control, †P < 0.05 vs. 2× AA, and ‡P < 0.05 vs. DN-AMPK; n = 4).
Fig. 3.
Fig. 3.
Elevated AA activate Notch1 by stimulating mammalian target of rapamycin (mTOR) signaling. A: HepG2 cells were treated with the indicated concentrations of AA for 1 h. Expression of P-Raptor (Ser792), P-mTOR-Ser2448, phosphorylated S6 kinase 1 (P-S6K1)-Thr389, phosphorylated 4E-binding protein 1 (P-4EBP1)-Thr37, and β-actin was analyzed by WB (*P < 0.05 vs. control; n = 4). B: cells were pretreated with rapamycin (Rap; 100 nM) for 1 h and then stimulated with the indicated concentrations of AA. Expression of P-S6K1, P-4EBP1, Notch1, and β-actin was determined by WB (*P < 0.05 vs. control, †P < 0.05 vs. 1× AA, and ‡P < 0.05 vs. 2× AA; n = 4). C: wild-type (WT) and tuberous sclerosis complex 2 (TSC2)−/− mouse embryonic fibroblasts (MEFs) were treated with Rap (100 nM) for 24 h. Cell lysates were subjected to WB to determine the expression of P-mTOR, P-S6K1, Notch1, and β-actin (*P < 0.05 vs. WT control and †P < 0.05 vs. TSC2−/− control; n = 4). D: TSC2−/− MEFs were transfected with C-siRNA or mTOR siRNA (mTOR-si) for 48 h. Expression of P-S6K1, P-4EBP1, Notch1, and β-actin was analyzed by WB (*P < 0.05; n = 3). E: insulin-stimulated phosphorylation of IRS-1 and Akt in HepG2 cells was measured by WB (*P < 0.05 vs. control, †P < 0.05 vs. 2× AA, and ‡P < 0.05 vs. 2× AA/insulin; n = 4). F: phosphorylation of IRS-1 at Ser307 was assayed by WB (*P < 0.05; n = 3). G: glycogen synthesis was assayed as described in materials and methods (*P < 0.05 vs. control, †P < 0.05 vs. 2× AA, and ‡P < 0.05 vs. 2× AA/insulin; n = 4).
Fig. 4.
Fig. 4.
STAT3 mediates the activation of Notch1 by mTOR signaling. A: HepG2 cells were treated with the indicated concentrations of AA for 1 h. Expression of P-STAT3-Ser727 and STAT3 was determined by WB (*P < 0.05 vs. control; n = 5). B: cells were pretreated with indicated concentrations of Rap (100 nM) for 1 h and then stimulated with 2× AA for 1 h. Cell lysates were subjected to WB to detect P-STAT3 (*P < 0.05 vs. control and †P < 0.05 vs. 2× AA; n = 5). C: WB analyses for P-STAT3 in WT and TSC2−/− MEFs (*P < 0.05 vs. WT control and †P < 0.05 vs. TSC2−/− control; n = 3). D: TSC2−/− MEFs were transfected with C-siRNA or mTOR-si for 48 h. Phosphorylation of STAT3 was analyzed by WB (*P < 0.05 vs. control; n = 3). E, top: expression of suppressor of cytokine signaling-3 (SOCS3) in HepG2 cells was detected by WB. E, bottom: HepG2 cells were pretreated with the indicated concentrations of AG490 for 1 h and then stimulated with 2× AA. Expression of P-STAT3 and Notch1 was detected by WB (*P < 0.05 vs. control and †P < 0.05 vs. 2× AA). F: WT and TSC2−/− MEFs were treated with AG490 (50 μM) for 24 h, and protein levels of P-S6K1, P-STAT3, STAT3, Notch1, and β-actin were measured by WB (*P < 0.05 vs. WT control and †P < 0.05 vs. TSC2−/− control; n = 3). G: TSC2−/− MEFs were transfected with C-siRNA or STAT3 siRNA (STAT3-si). Protein levels of P-S6K1, P-STAT3, STAT3, Notch1, and β-actin were evaluated by WB (*P < 0.05 vs. control; n = 3). H: WT and TSC2−/− MEFs were treated with Met (2 mM) for 1 h, and expression of P-AMPK, Notch1, and β-actin was assessed by WB (*P < 0.05 vs. WT control; n = 3).
Fig. 5.
Fig. 5.
Activation of AMPK by Met inhibits mTOR/STAT3 signaling. A: TSC2−/− MEFs were pretreated with Rap (100 nM), AG490 (50 μM), or DAPT (10 μM) for 24 h and then stimulated with insulin (100 nM) for 10 min. Protein levels of P-IRS-1 and IRS-1 were detected by WB (*P < 0.05 vs. control; n = 4). B: glucose uptake was determined as described in materials and methods (*P < 0.05 vs. control and †P < 0.05 vs. insulin; n = 4). C: protein levels of P-AMPK, P-mTOR, P-S6K1, P-4EBP1, P-STAT3, and β-actin were analyzed by WB in HepG2 cells (*P < 0.05 vs. control and †P < 0.05 vs. 2× AA; n = 4). D: HepG2 cells that were infected with adenovirus encoding GFP, DN-AMPK, or CA-AMPK overnight were treated with metformin and 2× AA for 1 h. Expression of P-mTOR, P-4EBP1, P-S6K1, P-STAT3, and β-actin was assayed by WB (*P < 0.05 vs. GFP and †P < 0.05 vs. GFP/2× AA; n = 3). E: mouse primary hepatocytes were treated with Met (2 mM) or Rap (100 nM) for 1 h in the presence or absence of 2× AA. Protein levels of P-AMPK, P-mTOR, P-STAT3, Notch1, and Rbp-Jκ were assessed by WB (*P < 0.05 vs. control and †P < 0.05 vs. 2× AA; n = 3). F: glycogen synthesis in mouse primary hepatocytes was assayed as described in materials and methods (*P < 0.05 vs. control, †P < 0.05 vs. insulin, ‡P < 0.05 vs. 2× AA/insulin; n = 4).
Fig. 6.
Fig. 6.
AMPK activation by Met attenuates high-protein diet (HPD)-induced insulin resistance through inhibition of mTOR/STAT3/Notch1 signaling. Mice were fed a normal diet (ND) or HPD and treated with Met or Rap for 8 wk. A: daily caloric intake was calculated from the amount of ingested food in individually caged mice; n = 10 in each group. B: body weights were monitored at the week indicated; n = 10 in each group. NS, not significant. C: fasting blood glucose levels were measured in tail vein blood samples using a glucometer; n = 8 in each group. D: expression of G6Pase and PEPCK mRNA in the liver was measured by RT-PCR (*P < 0.05 vs. ND and †P < 0.05 vs. HPD; n = 5). E: liver homogenates prepared from HPD-fed and Met-treated HPD-fed mice were subjected to WB to detect the protein levels of P-AMPK, P-S6K1, and P-4EBP1 (*P < 0.05 vs. HPD; n = 6). F: the expression of P-STAT3, STAT3, and Notch1 in liver lysates was analyzed by WB (*P < 0.05 vs. HPD; n = 6). G: insulin-stimulated phosphorylation of S6K1, IRS-1, and Akt was examined by WB (*P < 0.05 vs. ND and †P < 0.05 vs. ND/insulin; n = 6). H: WB analysis of P-IRS-1 and P-Akt (*P < 0.05 vs. HPD and †P < 0.05 vs. HPD/insulin; n = 6).
Fig. 7.
Fig. 7.
Rap prevents HPD-impaired insulin signaling. A: the expression of P-STAT3, Notch1, and β-actin in liver homogenates was measured by WB (*P < 0.05 vs. HPD; n = 6/group). B: insulin-stimulated phosphorylation of IRS-1 and Akt was assessed by WB (*P < 0.05 vs. HPD/insulin; n = 6/group). C: schematic representation of a signaling mechanism by which AMPK inhibits elevated AA-induced insulin resistance. HPD and AA stimulate mTOR signaling, which activates STAT3, leading to the upregulation of Notch1 and consequent insulin resistance. Activation of AMPK prevents insulin resistance by the suppression of the mTOR/STAT3/Notch1 pathway.

Similar articles

Cited by

References

    1. Adibi SA. Influence of dietary deprivations on plasma concentration of free amino acids of man. J Appl Physiol 25: 52–57, 1968 - PubMed
    1. Armstrong JL, Bonavaud SM, Toole BJ, Yeaman SJ. Regulation of glycogen synthesis by amino acids in cultured human muscle cells. J Biol Chem 276: 952–956, 2001 - PubMed
    1. Calo V, Migliavacca M, Bazan V, Macaluso M, Buscemi M, Gebbia N, Russo A. STAT proteins: from normal control of cellular events to tumorigenesis. J Cell Physiol 197: 157–168, 2003 - PubMed
    1. Capano M, Crompton M. Bax translocates to mitochondria of heart cells during simulated ischaemia: involvement of AMP-activated and p38 mitogen-activated protein kinases. Biochem J 395: 57–64, 2006 - PMC - PubMed
    1. Carling D. The AMP-activated protein kinase cascade—a unifying system for energy control. Trends Biochem Sci 29: 18–24, 2004 - PubMed

Publication types

MeSH terms

LinkOut - more resources