. 2014 Feb;85(2):368-80.
doi: 10.1124/mol.113.089292. Epub 2013 Dec 3.

Morphine regulates expression of μ-opioid receptor MOR-1A, an intron-retention carboxyl terminal splice variant of the μ-opioid receptor (OPRM1) gene via miR-103/miR-107

Affiliations

Morphine regulates expression of μ-opioid receptor MOR-1A, an intron-retention carboxyl terminal splice variant of the μ-opioid receptor (OPRM1) gene via miR-103/miR-107

Zhigang Lu et al. Mol Pharmacol. 2014 Feb.

Abstract

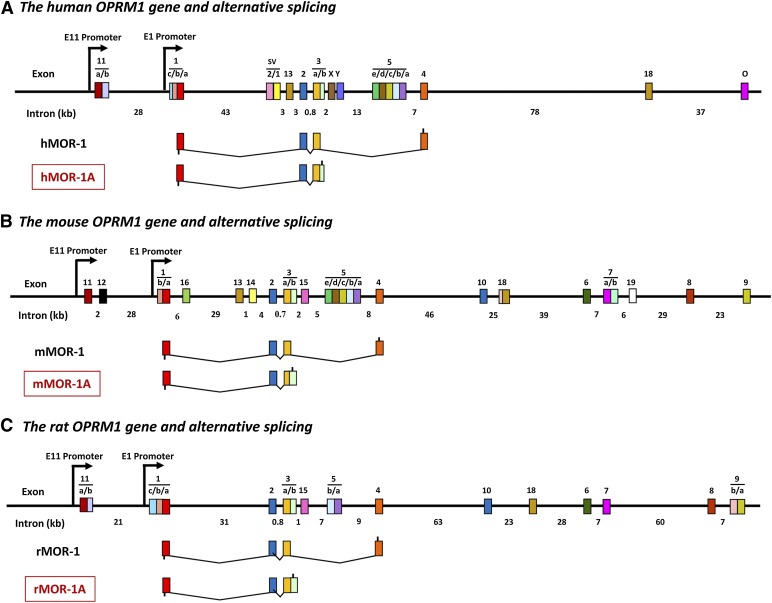
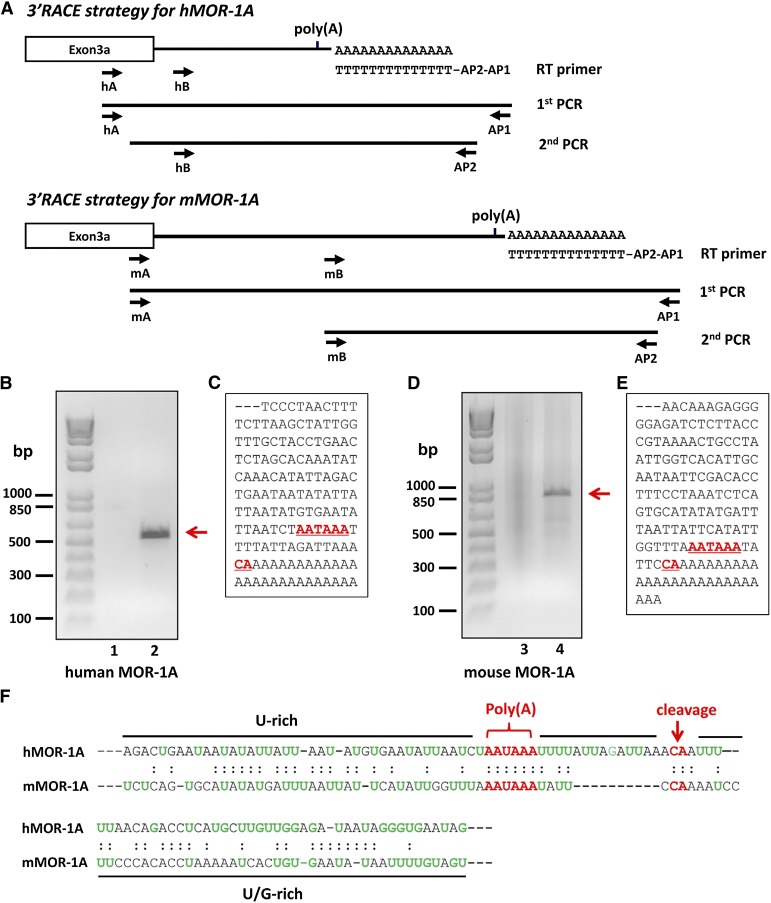
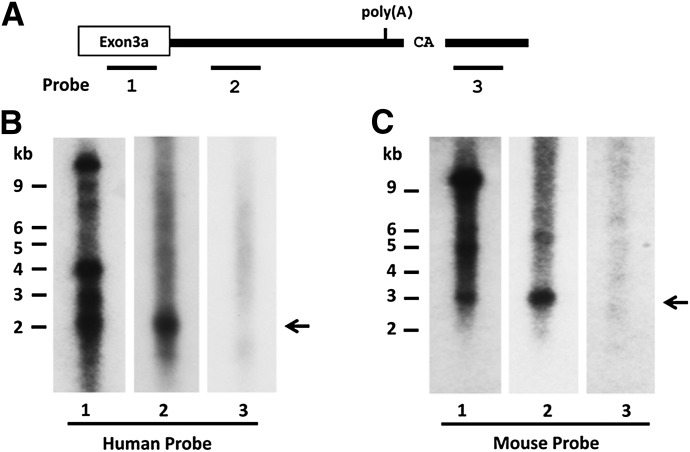
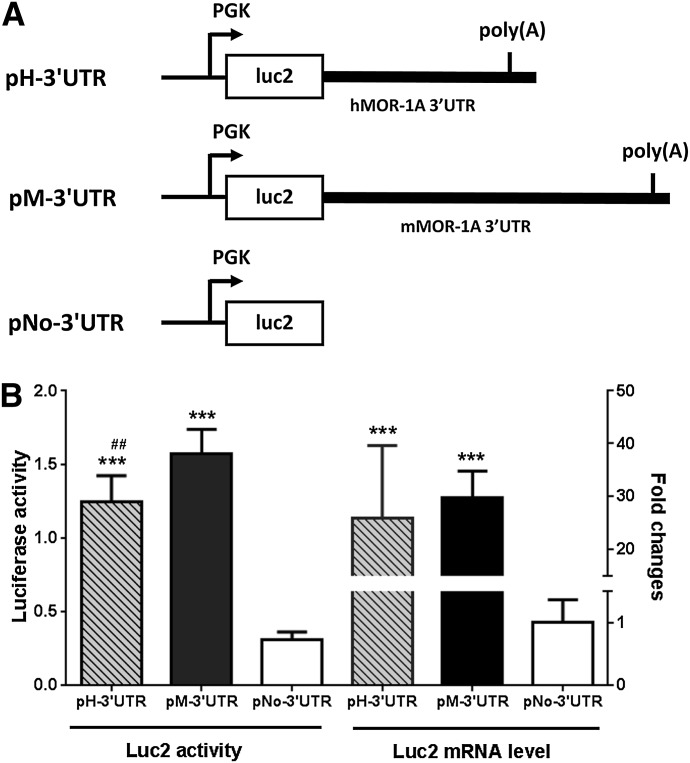
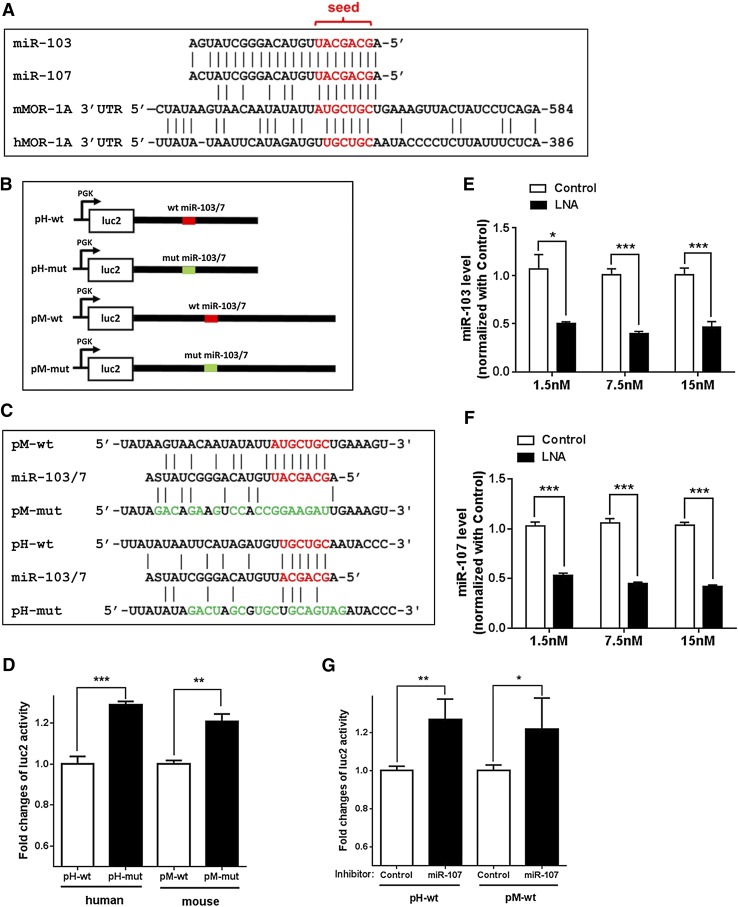
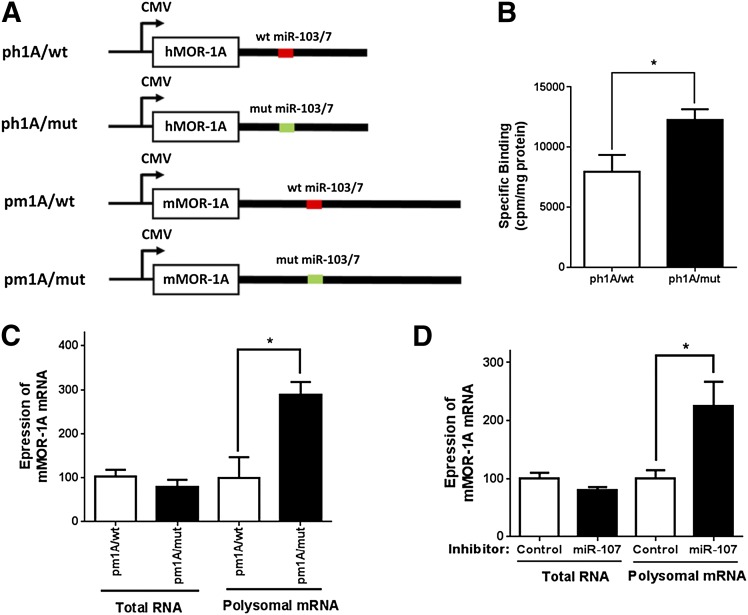
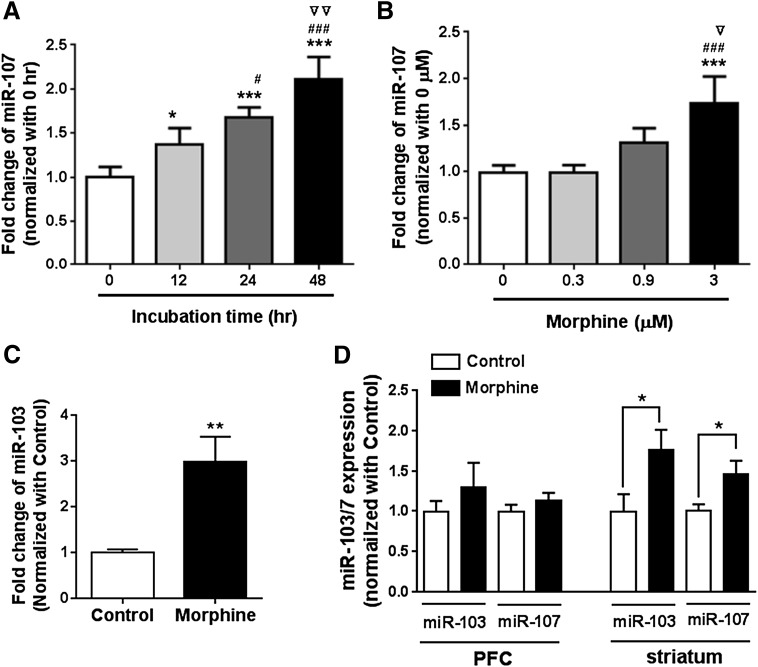
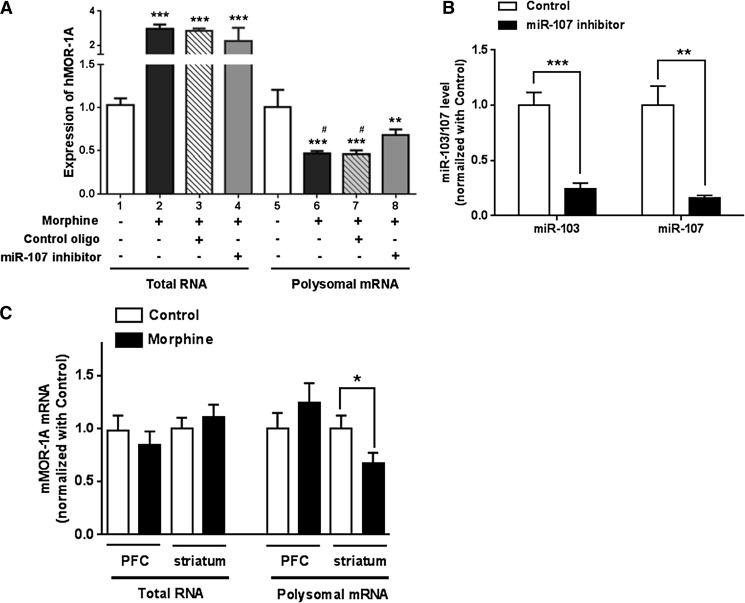
The μ-opioid receptor (MOR-1) gene OPRM1 undergoes extensive alternative splicing, generating an array of splice variants. Of these variants, MOR-1A, an intron-retention carboxyl terminal splice variant identical to MOR-1 except for the terminal intracellular tail encoded by exon 3b, is quite abundant and conserved from rodent to humans. Increasing evidence indicates that miroRNAs (miRNAs) regulate MOR-1 expression and that μ agonists such as morphine modulate miRNA expression. However, little is known about miRNA regulation of the OPRM1 splice variants. Using 3'-rapid amplification cDNA end and Northern blot analyses, we identified the complete 3'-untranslated region (3'-UTR) for both mouse and human MOR-1A and their conserved polyadenylation site, and defined the role the 3'-UTR in mRNA stability using a luciferase reporter assay. Computer models predicted a conserved miR-103/107 targeting site in the 3'-UTR of both mouse and human MOR-1A. The functional relevance of miR-103/107 in regulating expression of MOR-1A protein through the consensus miR-103/107 binding sites in the 3'-UTR was established by using mutagenesis and a miR-107 inhibitor in transfected human embryonic kidney 293 cells and Be(2)C cells that endogenously express human MOR-1A. Chronic morphine treatment significantly upregulated miR-103 and miR-107 levels, leading to downregulation of polyribosome-associated MOR-1A in both Be(2)C cells and the striatum of a morphine-tolerant mouse, providing a new perspective on understanding the roles of miRNAs and OPRM1 splice variants in modulating the complex actions of morphine in animals and humans.


Figures

Fig. 1.
Fig. 1.
Schematic of OPRM1 gene structure and MOR-1A splice variants. MOR-1A variants from the human (A), mouse (B), and rat (C) OPRM1 genes. Exons and introns are shown by colored boxes and black horizontal lines, respectively. Promoters are indicated by arrows. Exons are numbered in the order in which they were identified. Translation start and stop points are shown by bars below and above exon boxes, respectively. The complete list of the mouse OPRM1 alternative splicing was described in the reviews by Pan (2005) and Pasternak and Pan (2013).
Fig. 2.
Fig. 2.
Cloning 3′-UTRs of hMOR-1A and mMOR-1A by 3′-RACE. (A) Schematic of the 3′-RACE strategy. The 3′-RACE was performed as described in Materials and Methods. Primers are shown by arrows. (B and D) Analysis of PCR products on agarose gel. The first- and second-round PCR products of hMOR-1A (B) and mMOR-1A (D) were separated on 1.5% agarose gel and stained with ethidium bromide. The gel was imaged with ChemiDoc MP System. Lanes 1 and 3: first-round PCR products. Lanes 2 and 4: second-round PCR products. (C and E) Partial cDNA sequences of the PCR fragments for hMOR-1A (C) and mMOR-1A (E). Poly(A) signal and cleavage sites are indicated by underlined red and bold letters. (F) Alignment of the 3′-UTRs of hMOR-1A and mMOR-1A. The poly(A) signal and cleavage sites are shown by red letters, and U-rich or U/G-rich regions are indicated by black lines.
Fig. 3.
Fig. 3.
Northern blot analysis. (A) Schematic of the 3′-UTRs of hMOR-1A and mMOR-1A and relative positions of the probes. (B and C) Northern blots. Northern blot analysis for hMOR-1A (B) and mMOR-1A (C) was performed using poly(A) plus RNAs from Be(2)C cells and mouse brain, as described in Materials and Methods. The full length transcripts of hMOR-1A (∼2 kb) and mMOR-1A (∼3 kb) are shown by arrows.
Fig. 4.
Fig. 4.
Role of the 3′-UTR of hMOR-1A and mMOR-1A in stabilizing luciferase mRNA. (A) Schematic of the plasmid constructs. The complete 3′-UTR of hMOR-1A and mMOR-1A containing poly(A), cleavage site and U/G-rich region was subcloned downstream of the firefly luciferase (luc2) coding region, as pH-3′-UTR and pM-3′-UTR, respectively, as described in Materials and Methods. The phosphoglycerate kinase (PGK) promoter driving the transcription is shown by arrows. (B) The Luc2 activity and mRNA level of the transfected constructs. The lysates from transfected HEK293 cells with the indicated constructs were used for analyzing luc2 activity by using Dual-Glo Luciferase Assay, as described in Materials and Methods. Total RNAs isolated from the transfected cells were used in reverse-transcription PCR to determine the expression of luc2 mRNA, as described in Materials and Methods. Statistically significant differences were calculated by one-way analysis of variance (ANOVA) with Tukey’s post hoc analysis. ***P < 0.001 compared with pNo-3′-UTR; ##P < 0.01 compared with pM-3′UTR.
Fig. 5.
Fig. 5.
Regulation of luciferase activity by miR-103/107 through a conserved miR-103/107 binding site in MOR-1A 3′-UTRs. (A) Alignment of miR-103 and miR-107 sequences with hMOR-1A and mMOR-1A 3′-UTRs. The miR-103/107 seed and aligned 3′-UTR sequences are shown by red letters. The positions of the 3′-UTRs relative to the stop codons are indicated at the 3′ ends. (B) Schematic of pmir constructs. The 3′-UTRs of hMOR-1A and mMOR-1A containing wild-type or mutated miR-103/107 (miR-103/7) binding sites were subcloned into pmir plasmid as pH-wt, pM-wt, pH-mut, and pM-mut, respectively, as described in Materials and Methods. The wild-type and mutated miR-103/7 binding sites are indicated by red and green lines, respectively. (C) Mutagenized sequences of the miR-103/7 binding sites in pmir constructs. Mutagenized sequences are indicated by green letters. S represents G or C in miR-103/7 sequences. (D) Effect of the mutation of the miR-103/7 binding site on the luciferase activity. Transfection of indicated constructs and measurement of luciferase activity are described in Materials and Methods. Fold change of luc2 activity was calculated by normalizing the values of the mutant constructs with those of the wild-type constructs. ***P < 0.001, compared with pH-wt; **P < 0.01 (Student’s t test) compared with pM-wt. (E and F) Effect of miR-107 inhibitor on the expression of miR-103 (E) and miR-107 (F) in HEK 293 cells. Transfection of miR-107 inhibitor into HEK293 cells using indicated concentrations and determination of miR-107 level by reverse-transcription qPCR was as described in Materials and Methods. Fold inhibition by miR-107 inhibitor was calculated by normalizing the levels with inhibitor with those with a control LNA oligo. *P < 0.05; **P < 0.01; ***P < 0.001 (Student’s t test) compared with control LNA oligo. (G) Effect of miR-107 inhibitor on the luciferase activity in HEK293 cells. miR-107 inhibitor or control LNA oligo was cotransfected with pH-wt or pM-wt construct into HEK293 cells as described in Materials and Methods. Fold change of luc2 activity was calculated by normalizing the values of the miR-107 inhibitor with those of the control LNA oligo. **P < 0.01; *P < 0.05 (Student’s t test) compared with control LNA oligo.
Fig. 6.
Fig. 6.
Inhibition of MOR-1A expression by miR-103/107 at post-transcriptional level. (A) Schematic of pcDNA3 constructs. The constructs containing the coding sequences and 3′-UTRs of hMOR-1A and mMOR-1A with wild-type (red line) or mutated miR-103/7 binding site (green line) that were same as those in the pmir constructs (Fig. 5C) described in Materials and Methods. (B) Effect of the mutation on opioid binding. Transfection of indicated constructs, membrane isolation, and 125I-IBNtxA binding were described in Materials and Methods. *P < 0.05 compared with ph1A/wt. (C) Effect of miR-103/7 binding site on expression of mMOR-1A mRNA in HEK293 cells. Isolation of total RNA and polyribosomal (polysomal) fraction, RNA extraction from polysomal fraction and whole cells, and reverse-transcription qPCR were described in Materials and Methods. Expression of mMOR-1A mRNA was calculated by normalizing the level of pm1A/mut with that of pm1A/wt. *P < 0.05 compared with pm1A/wt. (D) Effect of miR-107 inhibitor on expression of mMOR-1A mRNA in HEK293 cells. miR-107 inhibitor (7.5 nM) or control LNA oligo (7.5 nM) was cotransfected with pm1A/wt into HEK293 cells. Expression of mMOR-1A mRNA was calculated by normalizing the level of miR-107 inhibitor with that of control LNA oligo (control). *P < 0.05 compared with control LNA oligo. Student’s t test was used.
Fig. 7.
Fig. 7.
Effect of chronic morphine on miR-107 expression in Be(2)C cells and morphine-tolerant mice. (A) Effect of morphine on miR-107 expression at various times in Be(2)C cells. Morphine treatment (3 µM) at indicated times and miR-107 expression determined by reverse-transcription qPCR were described in Materials and Methods. Expression of miR-107 is indicated by fold changes calculated by normalizing with the level of 0 hours. One-way analysis of variance (ANOVA) was used for analyzing statistical significance. *P < 0.05; ***P < 0.001 compared with 0 hours; #P < 0.05; ###P < 0.001 compared with 12 hours; ▿▿P < 0.01 compared with 24 hours. (B) Effect of morphine on miR-107 expression at various concentrations in Be(2)C cells. Expression of miR-107 was determined by reverse-transcription qPCR in Be(2)C cells treated with indicated concentrations of morphine for 48 hours. Fold changes were calculated by normalizing with the level of 0 µM. ***P < 0.001 compared with 0 µM; ###P < 0.001 compared with 0.3 µM; P < 0.05 compared with 0.9 µM. (C) Effect of morphine on miR-103 expression in Be(2)C cells. Be(2)C cells were treated with 3 µM of morphine for 48 hours, and miR-103 expression was determined by RT-qPCR as described in Materials and Methods. **P < 0.01 compared with no morphine treatment (control). (D) Effect of morphine on miR-103 and miR-107 expression in the PFC and striatum of the morphine tolerant mouse model. Expression of miR-103 and miR-107 was determined by RT-qPCR in the PFC and striatum of a morphine tolerant mouse model implanted with s.c. morphine pellet (75 mg) (morphine) or placebo pellet (control), as described in Materials and Methods. Student t test was used to analyze statistical difference. *P < 0.05 compared with control.
Fig. 8.
Fig. 8.
Effect of morphine on expression of MOR-1A via interaction between miR-103/107 and the MOR-1A 3′-UTRs. (A) Effect of morphine on expression of hMOR-1A in Be(2)C cells. Expression of hMOR-1A was determined by reverse-transcription qPCR in total RNA and polyribosomal (polysomal) fraction of Be(2)C cells treated with or without 3 µM morphine and transfected with 5 nM miR-107 inhibitor or control LNA oligo for 48 hours, as described in Materials and Methods. Expression level of hMOR-1A was calculated by normalizing with the levels of the cells without any treatment (lane 1 or 5). One-way analysis of variance (ANOVA) was used to analyze statistical difference. ***P < 0.001; **P < 0.01 compared with lane 1 or 5 compared with lane 1 or 5. #P < 0.05 compared with lane 8. (B) Effect of miR-107 inhibitor on miR-103 and miR-107 expression in Be(2)C cells. The miR-103 and miR-107 expression was determined by reverse-transcription qPCR in miR-107 inhibitor-treated Be(2)C cells (see A), as described in Materials and Methods. Fold inhibition by the miR-107 inhibitor was calculated by normalizing the levels with inhibitor with those with a control LNA oligo. **P < 0.01; ***P < 0.001 compared with control LNA oligo. (C) Effect of morphine on expression of mMOR-1A in the PFC and striatum of the morphine-tolerant mice. Isolation of total RNA and polysomal mRNA and RT-qPCR for mMOR-1A was described in Materials and Methods. Student t test was used. *P < 0.05 compared with control (placebo pellet).

Similar articles

Cited by

References

    1. Abbadie C, Pan YX, Drake CT, Pasternak GW. (2000a) Comparative immunohistochemical distributions of carboxy terminus epitopes from the mu-opioid receptor splice variants MOR-1D, MOR-1 and MOR-1C in the mouse and rat CNS. Neuroscience 100:141–153 - PubMed
    1. Abbadie C, Pan YX, Pasternak GW. (2000b) Differential distribution in rat brain of mu opioid receptor carboxy terminal splice variants MOR-1C-like and MOR-1-like immunoreactivity: evidence for region-specific processing. J Comp Neurol 419:244–256 - PubMed
    1. Abbadie C, Pasternak GW, Aicher SA. (2001) Presynaptic localization of the carboxy-terminus epitopes of the mu opioid receptor splice variants MOR-1C and MOR-1D in the superficial laminae of the rat spinal cord. Neuroscience 106:833–842 - PubMed
    1. Bare LA, Mansson E, Yang D. (1994) Expression of two variants of the human mu opioid receptor mRNA in SK-N-SH cells and human brain. FEBS Lett 354:213–216 - PubMed
    1. Baskerville S, Bartel DP. (2005) Microarray profiling of microRNAs reveals frequent coexpression with neighboring miRNAs and host genes. RNA 11:241–247 - PMC - PubMed

Publication types

LinkOut - more resources