. 2014 Jan;42(Database issue):D178-83.
doi: 10.1093/nar/gkt1254. Epub 2013 Dec 2.

DPRP: a database of phenotype-specific regulatory programs derived from transcription factor binding data

Affiliations

DPRP: a database of phenotype-specific regulatory programs derived from transcription factor binding data

David T W Tzeng et al. Nucleic Acids Res. 2014 Jan.

Abstract

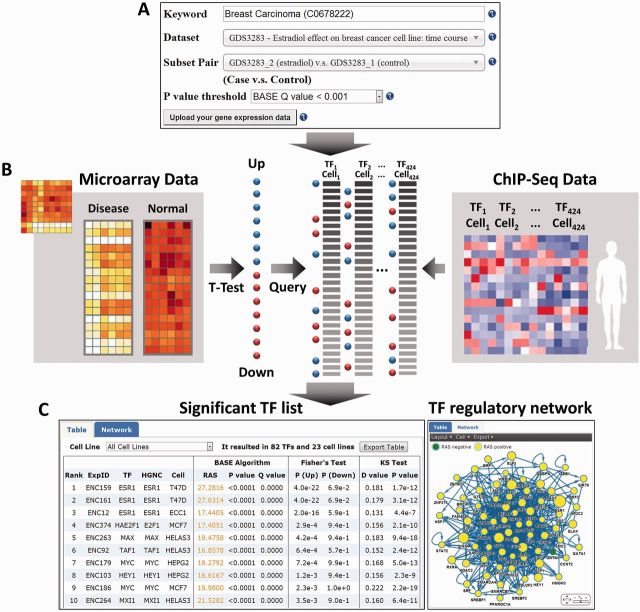
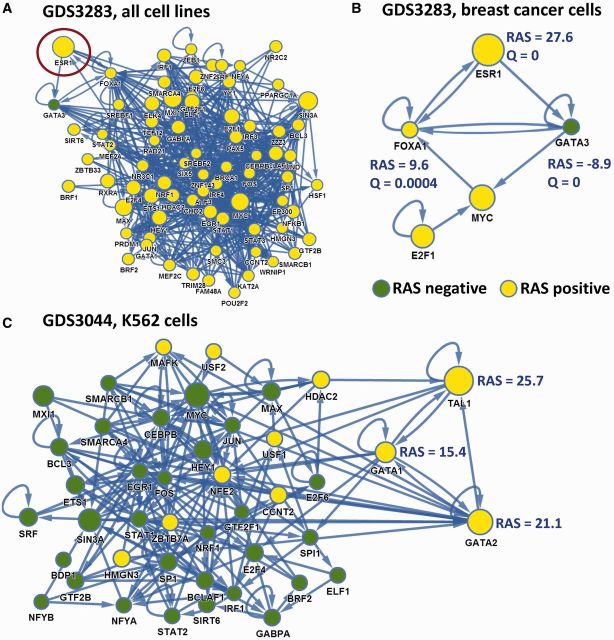
Gene expression profiling has been extensively used in the past decades, resulting in an enormous amount of expression data available in public databases. These data sets are informative in elucidating transcriptional regulation of genes underlying various biological and clinical conditions. However, it is usually difficult to identify transcription factors (TFs) responsible for gene expression changes directly from their own expression, as TF activity is often regulated at the posttranscriptional level. In recent years, technical advances have made it possible to systematically determine the target genes of TFs by ChIP-seq experiments. To identify the regulatory programs underlying gene expression profiles, we constructed a database of phenotype-specific regulatory programs (DPRP, http://syslab.nchu.edu.tw/DPRP/) derived from the integrative analysis of TF binding data and gene expression data. DPRP provides three methods: the Fisher's Exact Test, the Kolmogorov-Smirnov test and the BASE algorithm to facilitate the application of gene expression data for generating new hypotheses on transcriptional regulatory programs in biological and clinical studies.


Figures

Figure 1.
Figure 1.
An overview of the DPRP web interface. (A) Users can perform a query by the following procedures: (i) Users can input a disease name in the auto-completed keyword field, which provides a list of partially matched UMLS concepts for selection. Alternatively, users can also input a data set ID in the keyword field to select a specific data set. (ii) After UMLS concept selection, the data sets associated with the selected concept will be shown in a data set list, from which the user can select the data set of interest. (iii) Given a specific data set, the subset pairs from the selected data set will be displayed in a subset list, and then the user can select the subset pair to search TF regulatory programs. DPRP provides three different methods to rank the potential TFs, in which users can determine which ranking guidelines to use. In addition, users can upload their own gene expression data with gene list and t-value of t-test or log ratios between two subsets. (B) The database integrated gene expression data and ChIP-seq TF binding data to identify the regulatory programs underlying a selected phenotype pair. (C) The output web pages: DPRP generates a list of the TFs and ranks them by their P values or Q values. In TF table view, users can export the table of candidate TFs as a text file. Based on the ranked TF list, DPRP generates a regulatory network consisting of all significant TFs, in which users can export the TF network as a png, svg or xml file.
Figure 2.
Figure 2.
Example applications. (A) The complete regulatory TF network associated with estradiol treatment in MCF7 cells from the GDS3283 data set. The network contains 74 significant TFs identified from ChIP-seq data in all cell lines, in which the most significant TF is ESR1. This is the regulatory network output by the BASE method with Q < 0.001, when users select the GDS3283 data set and subset pair ‘estradiol treatment versus control’. (B) The regulatory TF network specific for T47D + MCF7 cell lines. In the network, only the significant TFs with ChIP-seq data from T47D and MCF7 are displayed. (C) The regulatory TF network associated with imatinib treatment in K562 cells from the GDS3044 data set. This is the output by the BASE method (Q < 0.001), when users select the GDS3044 data set with subset pair ‘imatinib treatment versus control’, and then select the K562-specific TF network. The network contains 43 significant TFs, in which the most significant TF is TAL1.

Similar articles

Cited by

References

    1. Barrett T, Wilhite SE, Ledoux P, Evangelista C, Kim IF, Tomashevsky M, Marshall KA, Phillippy KH, Sherman PM, Holko M, et al. NCBI GEO: archive for functional genomics data sets–update. Nucleic Acids Res. 2013;41:D991–D995. - PMC - PubMed
    1. Calkhoven CF, Ab G. Multiple steps in the regulation of transcription-factor level and activity. Biochem. J. 1996;317(Pt 2):329–342. - PMC - PubMed
    1. Boulikas T. Phosphorylation of transcription factors and control of the cell cycle. Crit. Rev. Eukaryot. Gene Expr. 1995;5:1–77. - PubMed
    1. Ouyang J, Valin A, Gill G. Regulation of transcription factor activity by SUMO modification. Methods Mol. Biol. 2009;497:141–152. - PubMed
    1. Rhodes DR, Kalyana-Sundaram S, Mahavisno V, Barrette TR, Ghosh D, Chinnaiyan AM. Mining for regulatory programs in the cancer transcriptome. Nat. Genet. 2005;37:579–583. - PubMed

Publication types

Substances