

The effects of colestilan versus placebo and sevelamer in patients with CKD 5D and hyperphosphataemia: a 1-year prospective randomized study
- PMID: 24302608
- PMCID: PMC4005560
- DOI: 10.1093/ndt/gft476
The effects of colestilan versus placebo and sevelamer in patients with CKD 5D and hyperphosphataemia: a 1-year prospective randomized study
Abstract
Background: This study compared the effects of short-term titrated colestilan (a novel non-absorbable, non-calcium, phosphate binder) with placebo, and evaluated the safety and efficacy of colestilan over 1 year compared with sevelamer, in patients with chronic kidney disease (CKD) 5D.
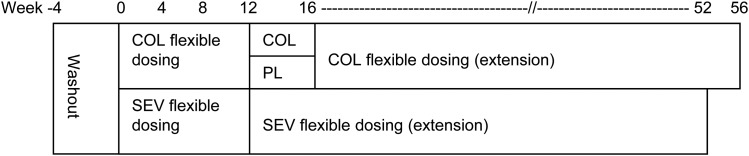
Methods: This prospective multicentre study comprised a 4-week phosphate binder washout period, a 16-week short-term, flexible-dose, treatment period (including a 4-week placebo-controlled withdrawal period) and a 40-week extension treatment phase.
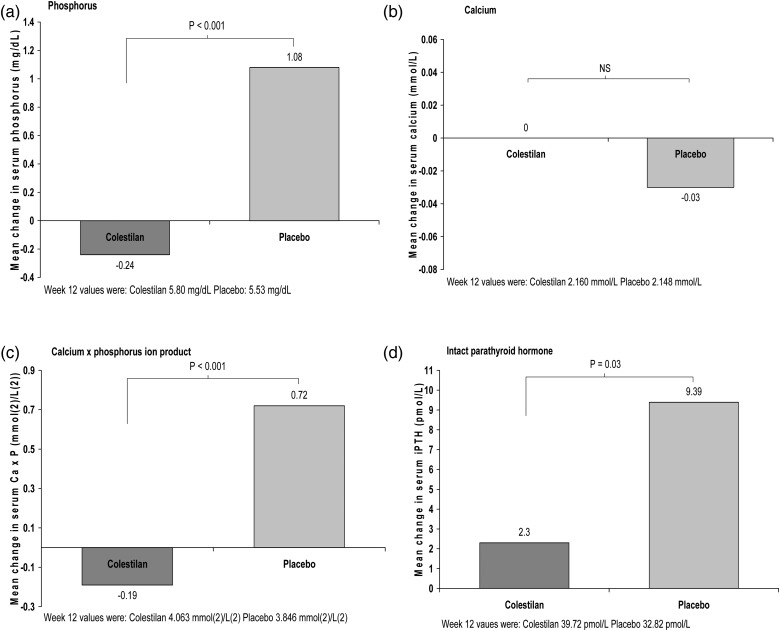
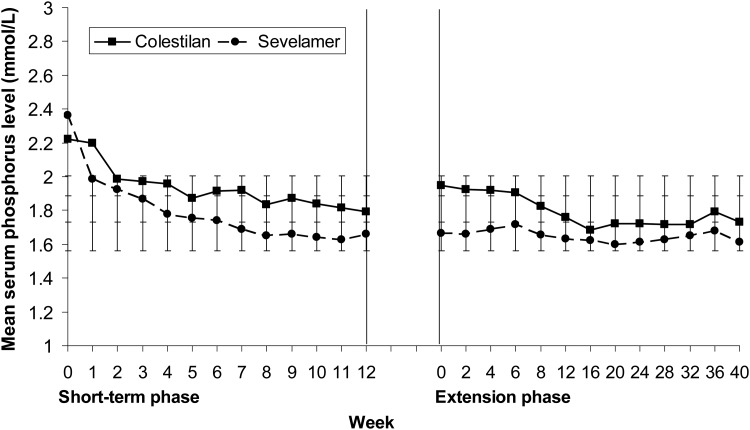
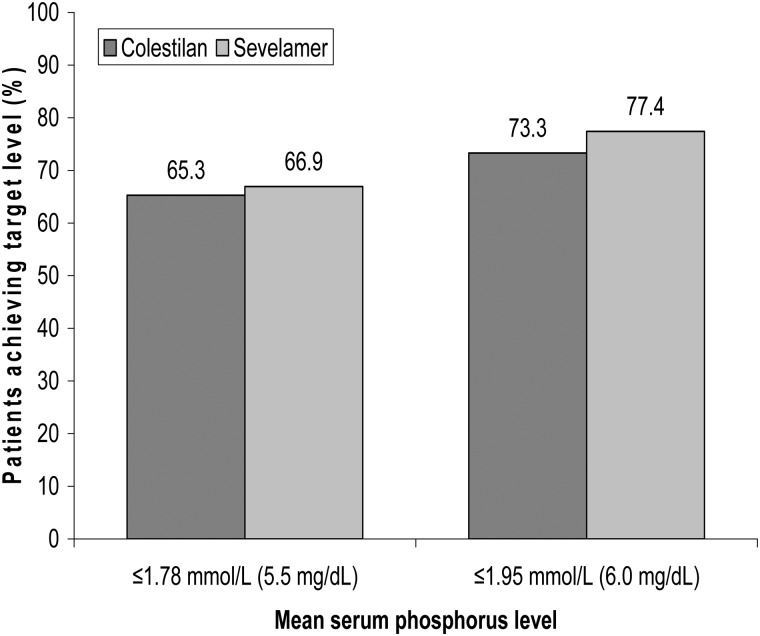
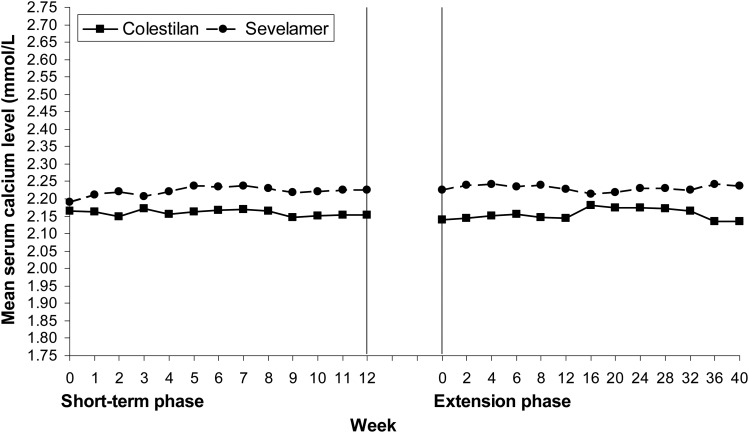
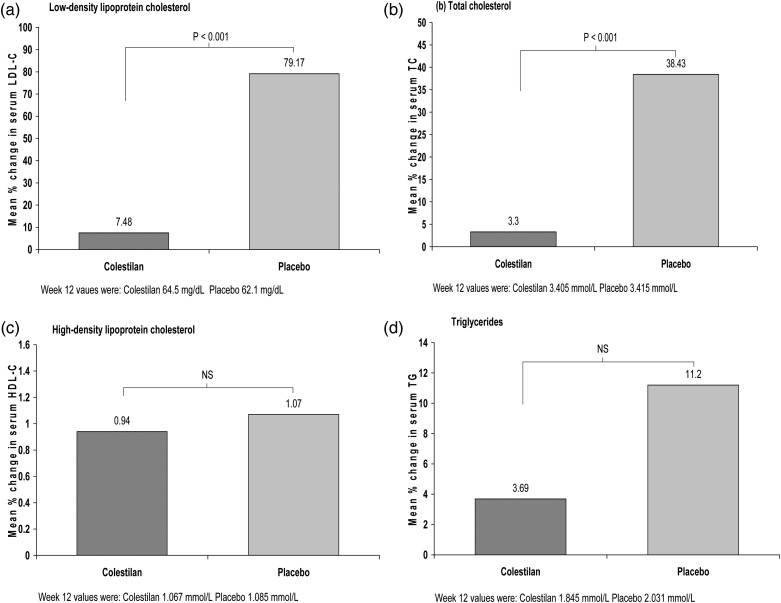
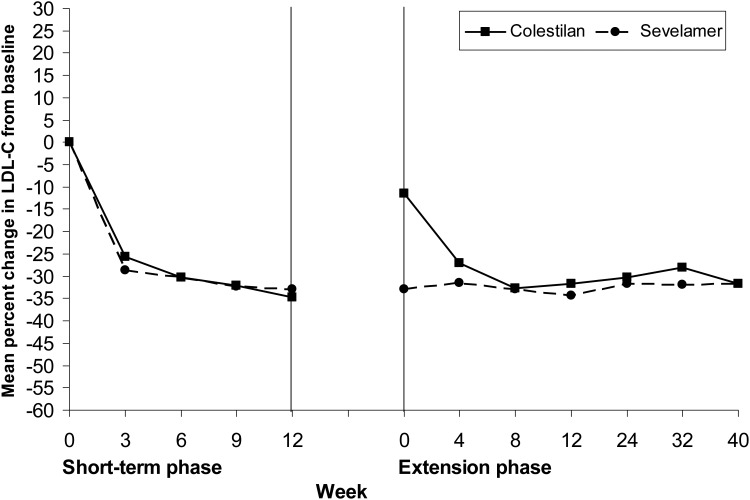
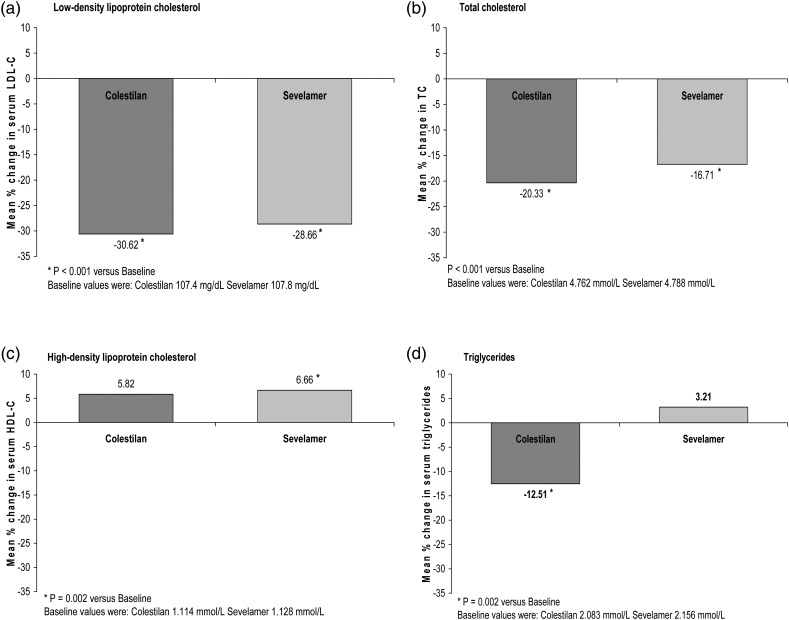
Results: At Week 16 (the end of the 4-week placebo-controlled withdrawal period), serum phosphorus level was 0.43 mmol/L (1.32 mg/dL) lower with colestilan than placebo (P < 0.001; primary end point). Serum LDL-C level was also lower with colestilan than with placebo (P < 0.001). Both colestilan and sevelamer produced significant reductions from baseline in serum phosphorus levels (P < 0.001), maintained for 1 year, and the proportion of patients achieving target levels of ≤1.78 mmol/L (5.5 mg/dL) or ≤1.95 mmol/L (6.0 mg/dL) at study end were similar (65.3 and 73.3%, respectively, for colestilan, and 66.9 and 77.4%, respectively, for sevelamer). Serum calcium level remained stable in the colestilan group but tended to increase slightly in the sevelamer group (end-of-study increase of 0.035 mmol/L over baseline). Both binders produced similar reductions from baseline in LDL-C level (P < 0.001), and responder rates after 1 year, using a target of <1.83 mmol/L (70 mg/dL) or <2.59 mmol/L (100 mg/dL) were similar in both groups (50.7 and 85.3% for colestilan and 54.0 and 80.6% for sevelamer). Colestilan was generally well tolerated.
Conclusions: Colestilan is effective and safe for the treatment of hyperphosphataemia in patients with CKD 5D, and affords similar long-term phosphorus and cholesterol reductions/responder rates to sevelamer.
Keywords: chronic kidney disease; colestilan; hyperphosphataemia; placebo; sevelamer.
Figures
References
-
- Slatopolsky E, Delmez JA. Pathogenesis of secondary hyperparathyroidism. Nephrol Dial Transplant. 1996;11(Suppl 3):130–135. doi:10.1093/ndt/11.supp3.130. - DOI - PubMed
-
- Goodman WG, Goldin J, Kuizon BD, et al. Coronary-artery calcification in young adults with end-stage renal disease who are undergoing dialysis. N Engl J Med. 2000;342:1478–1483. doi:10.1056/NEJM200005183422003. - DOI - PubMed
-
- Raggi P, Boulay A, Chasan-Taber S, et al. Cardiac calcification in adult hemodialysis patients. A link between end-stage renal disease and cardiovascular disease? J Am Coll Cardiol. 2002;39:695–701. doi:10.1016/S0735-1097(01)01781-8. - DOI - PubMed
-
- Block GA, Hulbert-Shearon TE, Levin NW, et al. Association of serum phosphorus and calcium x phosphate product with mortality risk in chronic hemodialysis patients: a national study. Am J Kidney Dis. 1998;31:607–617. doi:10.1053/ajkd.1998.v31.pm9531176. - DOI - PubMed
-
- Block GA, Klassen PS, Lazarus JM, et al. Mineral metabolism, mortality, and morbidity in maintenance hemodialysis. J Am Soc Nephrol. 2004;15:2208–2218. doi:10.1097/01.ASN.0000133041.27682.A2. - DOI - PubMed
Publication types
MeSH terms
Substances
LinkOut - more resources
Full Text Sources
Other Literature Sources
Medical
