. 2014 Jan 17;289(3):1551-63.
doi: 10.1074/jbc.M113.531392. Epub 2013 Dec 3.

The role of diacylglycerol kinase ζ and phosphatidic acid in the mechanical activation of mammalian target of rapamycin (mTOR) signaling and skeletal muscle hypertrophy

Affiliations

The role of diacylglycerol kinase ζ and phosphatidic acid in the mechanical activation of mammalian target of rapamycin (mTOR) signaling and skeletal muscle hypertrophy

Jae-Sung You et al. J Biol Chem. .

Abstract

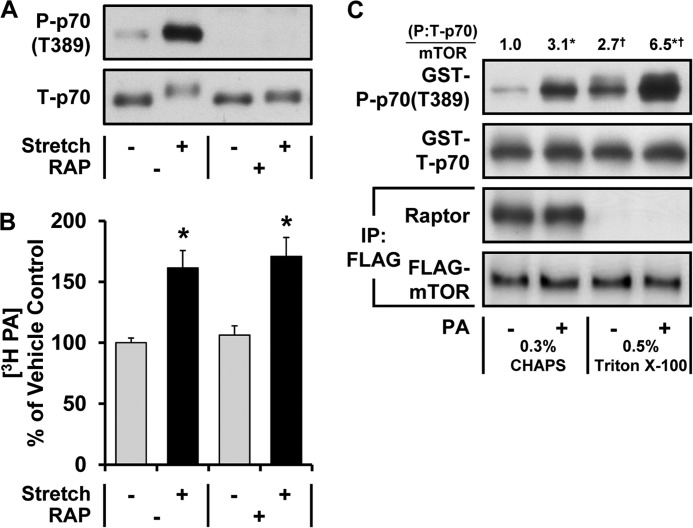
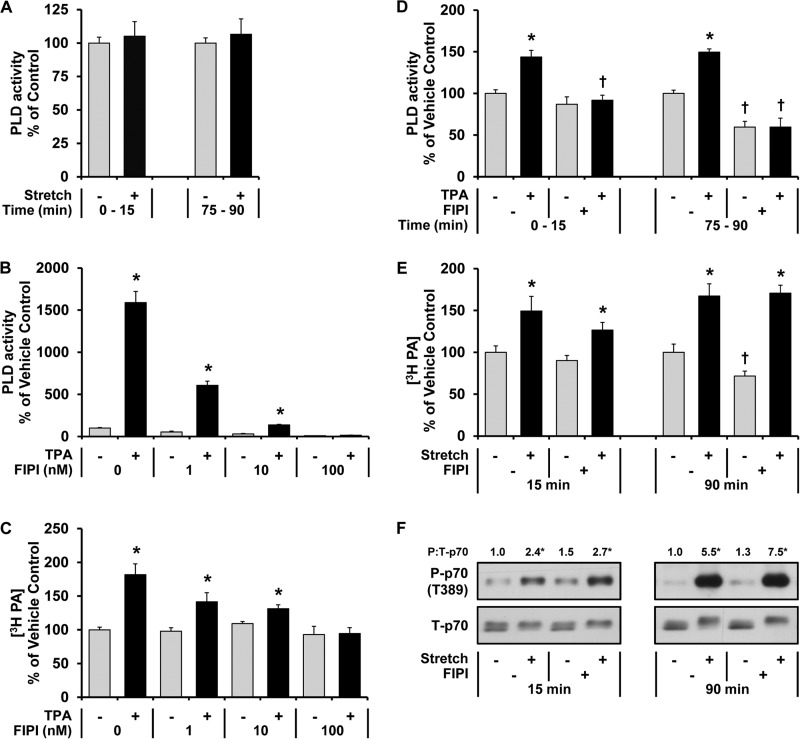
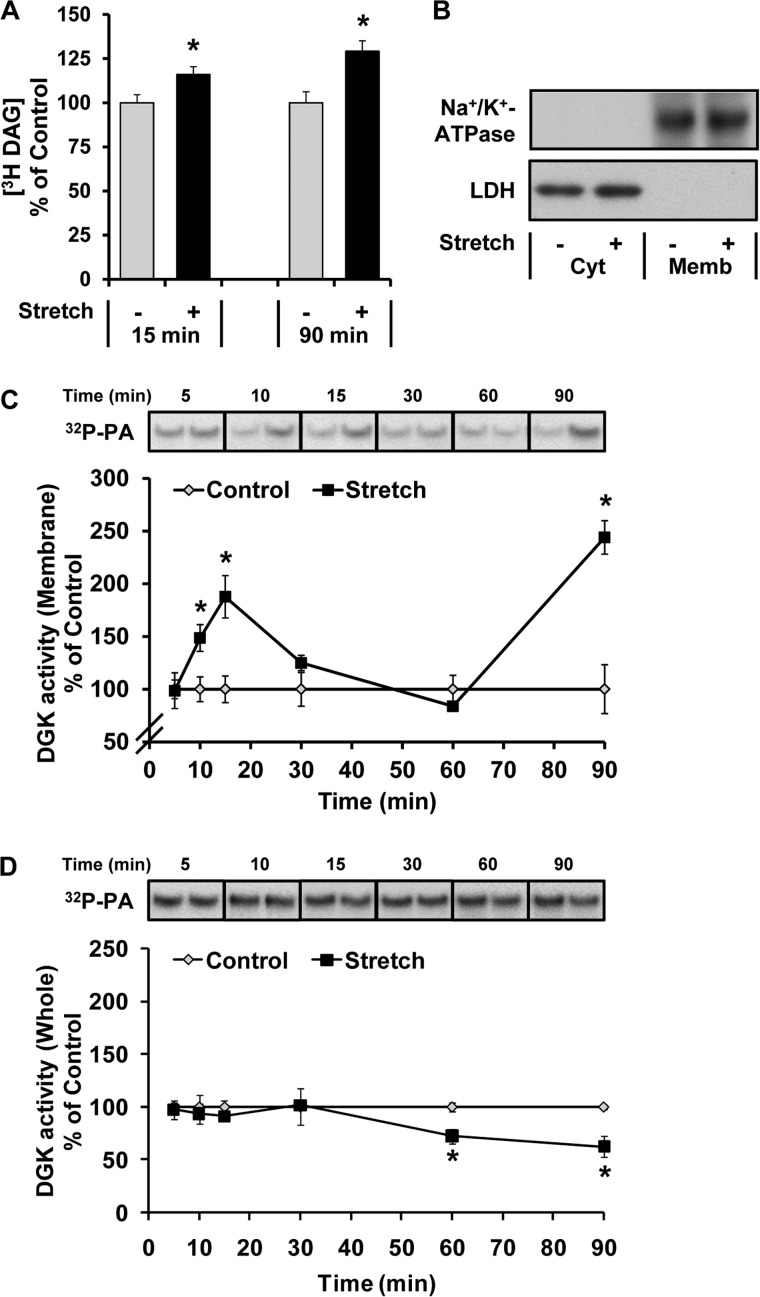
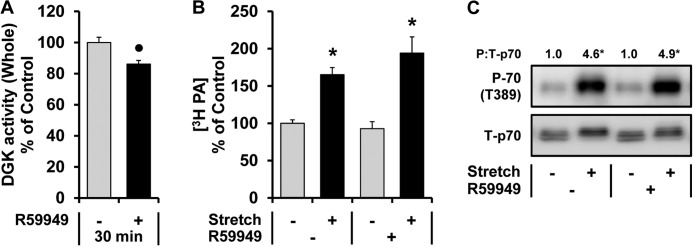
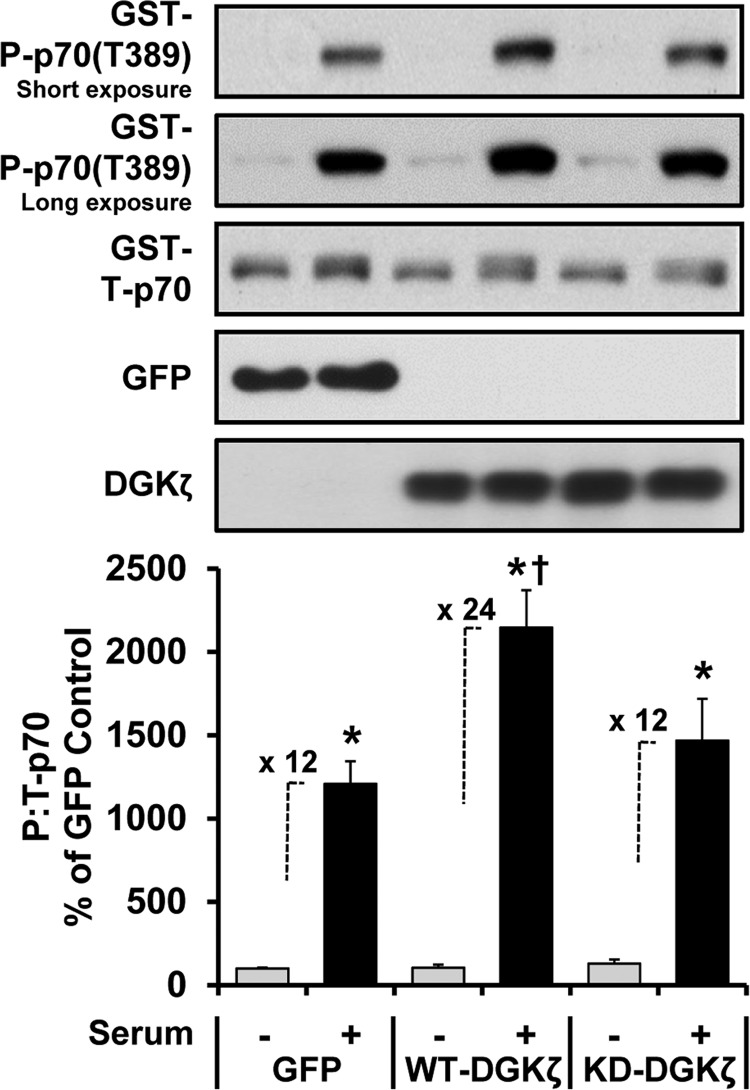
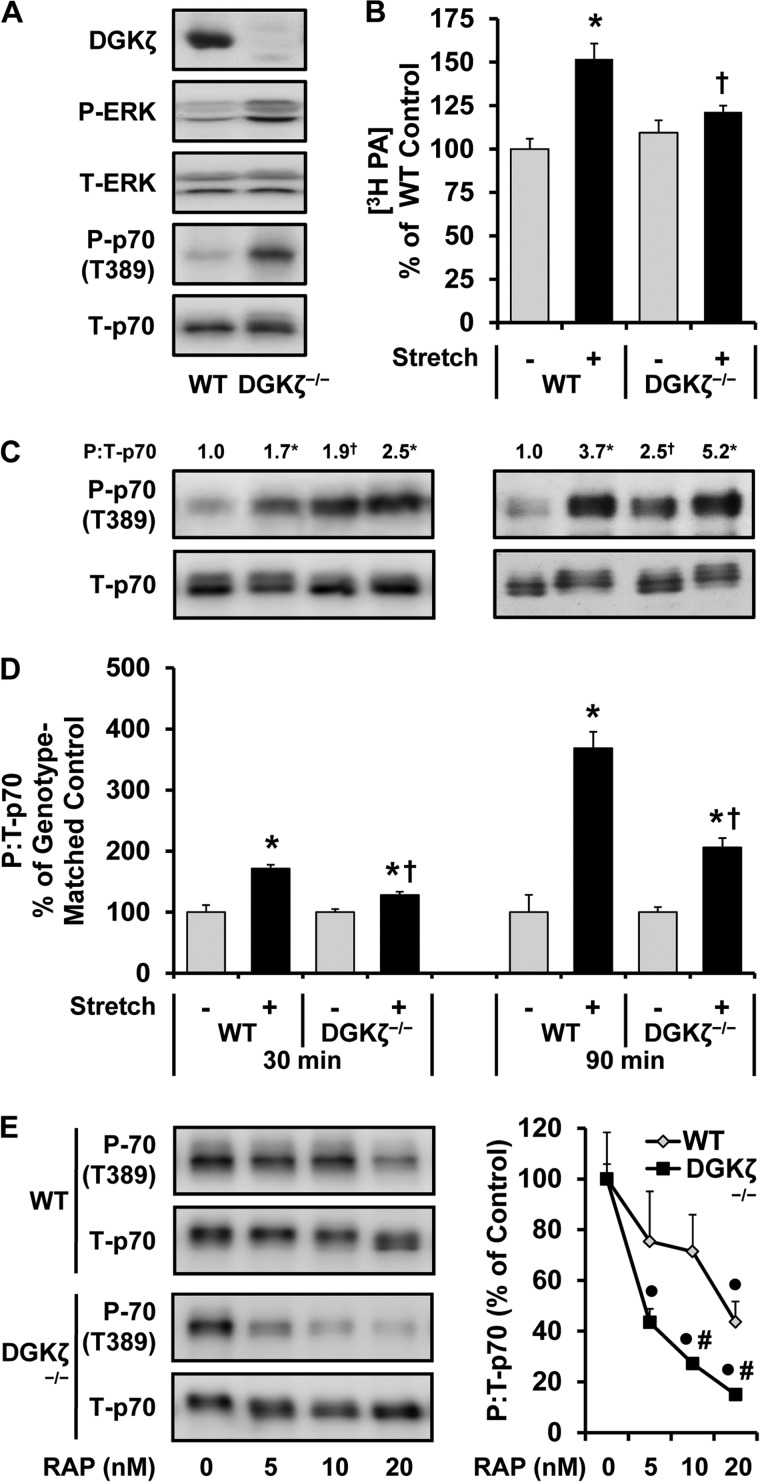
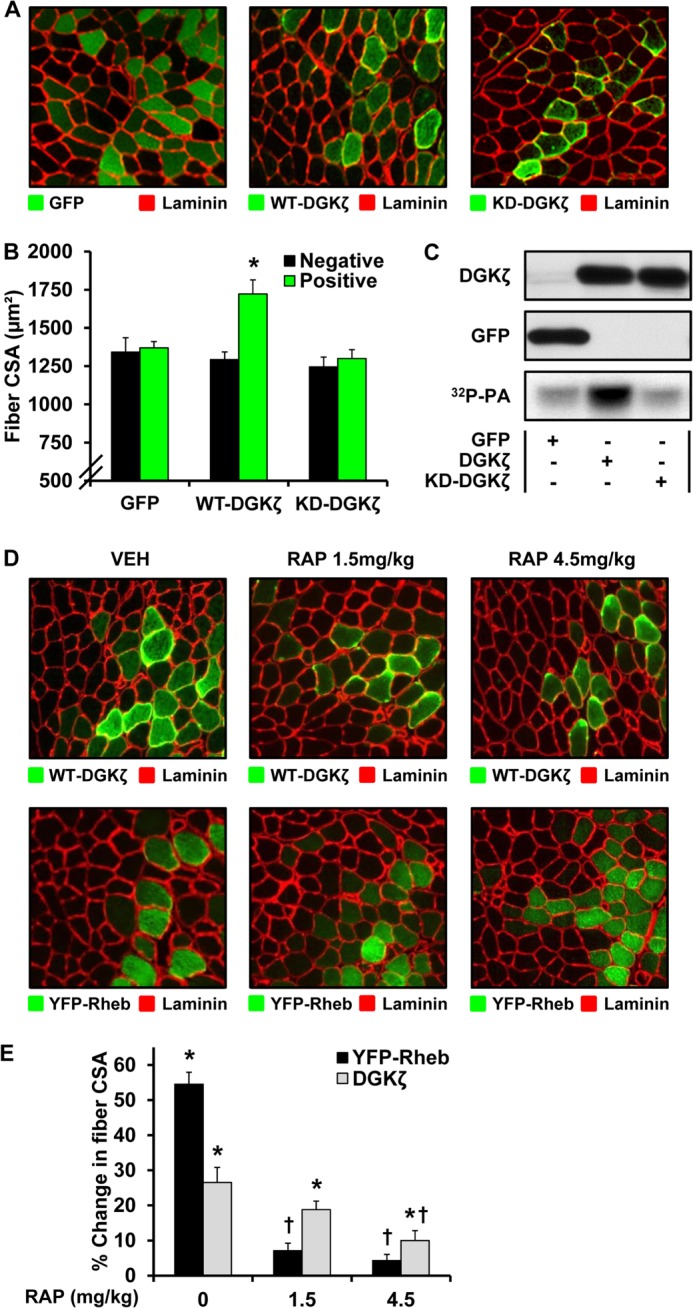
The activation of mTOR signaling is essential for mechanically induced changes in skeletal muscle mass, and previous studies have suggested that mechanical stimuli activate mTOR (mammalian target of rapamycin) signaling through a phospholipase D (PLD)-dependent increase in the concentration of phosphatidic acid (PA). Consistent with this conclusion, we obtained evidence which further suggests that mechanical stimuli utilize PA as a direct upstream activator of mTOR signaling. Unexpectedly though, we found that the activation of PLD is not necessary for the mechanically induced increases in PA or mTOR signaling. Motivated by this observation, we performed experiments that were aimed at identifying the enzyme(s) that promotes the increase in PA. These experiments revealed that mechanical stimulation increases the concentration of diacylglycerol (DAG) and the activity of DAG kinases (DGKs) in membranous structures. Furthermore, using knock-out mice, we determined that the ζ isoform of DGK (DGKζ) is necessary for the mechanically induced increase in PA. We also determined that DGKζ significantly contributes to the mechanical activation of mTOR signaling, and this is likely driven by an enhanced binding of PA to mTOR. Last, we found that the overexpression of DGKζ is sufficient to induce muscle fiber hypertrophy through an mTOR-dependent mechanism, and this event requires DGKζ kinase activity (i.e. the synthesis of PA). Combined, these results indicate that DGKζ, but not PLD, plays an important role in mechanically induced increases in PA and mTOR signaling. Furthermore, this study suggests that DGKζ could be a fundamental component of the mechanism(s) through which mechanical stimuli regulate skeletal muscle mass.

Keywords: Diacylglycerol Kinase ζ; Hypertrophy; Mechanotransduction; Phosphatidic Acid; Phospholipase D; Skeletal Muscle; mTOR.


Figures

FIGURE 1.
FIGURE 1.
Evidence that PA can function as a direct upstream activator of mTOR signaling in response to mechanical stimulation. A and B, mouse EDL muscles were held at Lo in an ex vivo organ culture system and treated as follows. A, preincubated with 150 nm rapamycin (RAP +) or the vehicle (RAP −, DMSO) for 30 min and then subjected to 90 min of a stretch (Stretch +) or control condition (Stretch −) followed by Western blot analysis for phosphorylated (P) and total (T) p70. B, prelabeled with [3H]myristic acid for 2 h. During the final 30 min of the prelabeling, the muscles were incubated with rapamycin or the vehicle as in A and then subjected to 90 min of the stretch or control conditions. The concentration of 3H-labeled PA was measured and expressed as a percentage of values obtained in the vehicle control samples. C, C2C12 myoblasts stably expressing FLAG-mTOR were serum-starved overnight and collected in either CHAPS or Triton X-100 lysis buffer. The lysates were subjected to immunoprecipitation (IP) for the FLAG epitope, and then the immunoprecipitates were incubated for 15 min with 150 μm PA vesicles (PA +) or 150 μm PC vesicles as a control condition (PA −). The kinase activity of mTOR was then assayed with GST-p70 as a substrate. The resulting samples were subjected to Western blot analysis for the indicated proteins, and the phosphorylated:total ratios of GST-p70 were divided by the amount of mTOR in each reaction. These values were then expressed as a ratio of the values obtained in the PC-treated samples collected in CHAPS lysis buffer. The values were obtained from four independent experiments. All values are presented as the mean (±S.E. in graphs, n = 3–11 per group). *, significantly different from the drug (B)- or lysis buffer (C)-matched control group. †, significantly different from the stimulation-matched CHAPS group; p ≤ 0.05.
FIGURE 2.
FIGURE 2.
Changes in PLD activity are not required for a mechanically induced increase in PA or mTOR signaling. A, mouse EDL muscles were held at Lo in an ex vivo organ culture system, prelabeled with [3H]myristic acid for 2 h, and then subjected to 15 or 90 min of a stretch (Stretch +) or control condition (Stretch −). PLD activity was measured throughout a 15-min period and expressed as a percentage of the values obtained in the time-matched control samples. B and C, C2C12 myoblasts were prelabeled in serum-free medium containing [3H]myristic acid overnight. After washing with fresh medium, the cells were preincubated with 1, 10, or 100 nm FIPI or the vehicle (FIPI 0, DMSO) for 30 min and then stimulated with 100 nm TPA (TPA +) or the vehicle as a control condition (TPA −, DMSO) for 15 min in the presence (B) or absence (C) of 0.3% 1-butanol. The cells were collected, and PLD activity (B) or the concentration of 3H-labeled PA (C) was measured and expressed as a percentage of the values obtained in the vehicle control samples. The values were obtained from five independent experiments. D--F, mouse EDL muscles were held at Lo in an ex vivo organ culture system and treated as follows. D and E, prelabeled with [3H]myristic acid for 2 h. During the final 30 min of prelabeling, the muscles were incubated with 100 nm FIPI (FIPI +) or the vehicle (FIPI−, DMSO). The muscles were then subjected to 15 or 90 min of stimulation with 1 μm TPA (TPA +) or the vehicle as a control condition (TPA −, DMSO) (D) or subjected to 15 or 90 min of the stretch or control conditions (E). PLD activity (D) or the concentration of 3H-labeled PA (E) was measured and expressed as a percentage of values obtained in the time-matched vehicle control samples. F, preincubated with FIPI or the vehicle as described above and then subjected to 15 or 90 min of the stretch or control conditions followed by Western blot analysis for phosphorylated (P) and total (T) p70. The phosphorylated:total ratios of p70 were expressed relative to the values obtained in the time-matched vehicle control samples. All values are presented as the mean (±S.E. in graphs, n = 3–8 per group). *, significantly different from the time- and drug-matched control group. †, significantly different from the time- and stimulation-matched vehicle group; p ≤ 0.05.
FIGURE 3.
FIGURE 3.
Mechanical stimulation increases DAG and membrane DGK activity. Mouse EDL muscles were held at Lo in an ex vivo organ culture system and treated as follows. A, prelabeled with [3H]myristic acid for 2 h and then subjected to 15 or 90 min of a stretch (Stretch +) or control condition (Stretch −). The concentration of 3H-labeled DAG was measured and expressed as a percentage of values obtained in the control samples. B, subjected to 15 min of the stretch or control conditions and then separated into cytosolic (Cyt) and membrane (Memb) fractions. The different fractions were then subjected to Western blot analysis for Na+/K+-ATPase and LDH. C and D, subjected to 5–90 min of the stretch or control conditions, and then DGK activity (32P-PA) in the membrane fraction (C) and whole lysates (D) was measured and expressed as a percentage of the values obtained in the time-matched control samples. All values are presented as the mean ± S.E. (n = 3–4 per group). *, Significantly different from the time-matched control group; p ≤ 0.05.
FIGURE 4.
FIGURE 4.
R59949 does not inhibit the mechanically induced increase in PA or the activation of mTOR signaling. Mouse EDL muscles were held at Lo in an ex vivo organ culture system and treated as follows. A, incubated with 100 μm R59949 (R59949 +) or the vehicle (R59949 −, DMSO) for 30 min. DGK activity from the whole lysates was measured and expressed as a percentage of values obtained in the vehicle control samples. B, prelabeled with [3H]myristic acid for 2 h. During the final 30 min of the prelabeling, the muscles were incubated with R59949 or the vehicle as described in A. The muscles were then subjected to 90 min of the stretch (Stretch +) or control conditions (Stretch −), and the concentration of 3H-labeled PA was measured and expressed as a percentage of values obtained in the vehicle control samples. C, preincubated with R59949 or the vehicle as described in A and then subjected to 90 min of the stretch or control conditions followed by Western blot analysis for phosphorylated (P) and total (T) p70. The phosphorylated:total ratios of p70 were expressed relative to the values obtained in the vehicle control samples. All values are presented as the mean (±S.E. in graphs, n = 3–8 per group). ●, significantly different from the vehicle group. *, significantly different from the drug-matched control group; p ≤ 0.05.
FIGURE 5.
FIGURE 5.
Overexpression of DGKζ enhances the serum-induced activation of mTOR signaling in a kinase activity-dependent manner. C2C12 myoblasts were co-transfected with plasmid DNA encoding GFP, wild type DGKζ (HA-WT-DGKζ), or kinase dead DGKζ (HA-KD-DGKζ) and GST-p70. The following day the cells were serum-starved overnight and then stimulated with 20% fetal bovine serum (Serum +) for 30 min. The cells were collected and then subjected to Western blot analysis for the indicated proteins. The phospho (P):total (T) ratios of GST-p70 were then expressed as a percentage of the values obtained in the GFP non-stimulated (control, Serum −) samples. Values are presented as the mean ± S.E. and were obtained from five independent experiments (n = 5–9 per group). *, significantly different from the plasmid-matched control group. †, significantly different from the stimulation-matched GFP group; p ≤ 0.05.
FIGURE 6.
FIGURE 6.
The mechanically induced increase in PA and the activation of mTOR signaling is impaired in muscles from DGKζ−/− mice. A, EDL muscles from WT and DGKζ−/− mice were collected and subjected to Western blot analysis for the indicated proteins. B--E, EDL muscles from WT and DGKζ−/− mice were held at Lo in an ex vivo organ culture system and treated as follows. B, prelabeled with [3H]myristic acid for 2 h and then subjected to 90 min of the stretch (Stretch +) or control conditions (Stretch −). The concentration of 3H-labeled PA was measured and expressed as a percentage of values obtained in WT control samples. C and D, subjected to 30 or 90 min of the stretch or control conditions followed by Western blot analysis for phosphorylated (P) and total (T) p70. The phosphorylated:total ratios of p70 were expressed relative to the values obtained in the time-matched WT control samples (C) or expressed as a percentage of the time- and genotype-matched control samples (D). E, preincubated with 5, 10, or 20 nm rapamycin (RAP) or the vehicle (RAP 0, DMSO) for 30 min and then subjected to 90 min of stretch followed by Western blot analysis for phosphorylated (P-) and total (T-) p70. The phosphorylated:total ratios of p70 were expressed as a percentage of values obtained in the genotype-matched vehicle samples. All values are presented as the mean (±S.E. in graphs, n = 3–9 per group). *, significantly different from the time- and genotype-matched control group. †, significantly different from the time- and stimulation-matched WT group. ●, significantly different from the genotype-matched vehicle group. #, significantly different from the drug-matched WT group; p ≤ 0.05.
FIGURE 7.
FIGURE 7.
Overexpression of DGKζ induces hypertrophy through a kinase-dependent and rapamycin-sensitive mechanism. A–C, mouse TA muscles were transfected with plasmid DNA encoding GFP, HA-WT-DGKζ, or HA-KD-DGKζ. A, the muscles were collected at 7 days post transfection, and cross-sections from the mid-belly of the muscles were subjected to immunohistochemistry for GFP and laminin or for HA and laminin. B, CSA of the transfected fibers (Positive) and non-transfected fibers (Negative) within each of the GFP-, HA-WT-DGKζ-, and HA-KD-DGKζ-transfected muscles. C, muscles were collected at 3 days post transfection, and whole lysates were subjected to a DGK activity assay (32P-PA) or Western blot analysis for the indicated proteins. D and E, mouse TA muscles were transfected with plasmid DNA encoding HA-WT-DGKζ or YFP-Rheb. Immediately after transfection the mice were subjected to a regime of daily 1.5 or 4.5 mg/kg rapamycin (RAP) or vehicle (RAP 0, DMSO) injections. D, the muscles were collected at 7 days post transfection, and cross-sections from the mid-belly of the muscles were subjected to immunohistochemistry for HA and laminin or for YFP and laminin. E, the CSA of the transfected fibers and non-transfected fibers within each of the HA-WT-DGKζ- and YFP-Rheb-transfected muscles was determined, and then the percent difference between the averaged CSA of the transfected fibers and non-transfected fibers of each muscle was calculated. All values are presented as the mean ± S.E. (n = 3–8 muscles per group, 35–120 fibers per muscle). *, significantly different from the drug- and plasmid-matched non-transfected fibers. †, significantly different from the plasmid-matched vehicle group; p ≤ 0.05.

References

    1. Hurley B. F., Hanson E. D., Sheaff A. K. (2011) Strength training as a countermeasure to aging muscle and chronic disease. Sports Med. 41, 289–306 - PubMed
    1. Goldberg A. L., Etlinger J. D., Goldspink D. F., Jablecki C. (1975) Mechanism of work-induced hypertrophy of skeletal muscle. Med. Sci. Sports 7, 185–198 - PubMed
    1. Goodman C. A., Frey J. W., Mabrey D. M., Jacobs B. L., Lincoln H. C., You J. S., Hornberger T. A. (2011) The role of skeletal muscle mTOR in the regulation of mechanical load-induced growth. J. Physiol. 589, 5485–5501 - PMC - PubMed
    1. Hornberger T. A. (2011) Mechanotransduction and the regulation of mTORC1 signaling in skeletal muscle. Int. J. Biochem. Cell Biol. 43, 1267–1276 - PMC - PubMed
    1. Avilés Mendoza G. J., Seidel N. E., Otsu M., Anderson S. M., Simon-Stoos K., Herrera A., Hoogstraten-Miller S., Malech H. L., Candotti F., Puck J. M., Bodine D. M. (2001) Comparison of five retrovirus vectors containing the human IL-2 receptor γ chain gene for their ability to restore T and B lymphocytes in the X-linked severe combined immunodeficiency mouse model. Mol. Ther. 3, 565–573 - PubMed

Publication types

MeSH terms

LinkOut - more resources