. 2013 Nov;11(11):e1001719.
doi: 10.1371/journal.pbio.1001719. Epub 2013 Nov 26.

ANXUR receptor-like kinases coordinate cell wall integrity with growth at the pollen tube tip via NADPH oxidases

Affiliations

ANXUR receptor-like kinases coordinate cell wall integrity with growth at the pollen tube tip via NADPH oxidases

Aurélien Boisson-Dernier et al. PLoS Biol. 2013 Nov.

Abstract

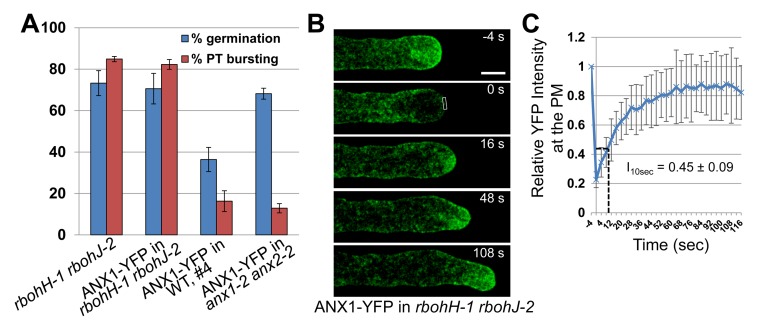
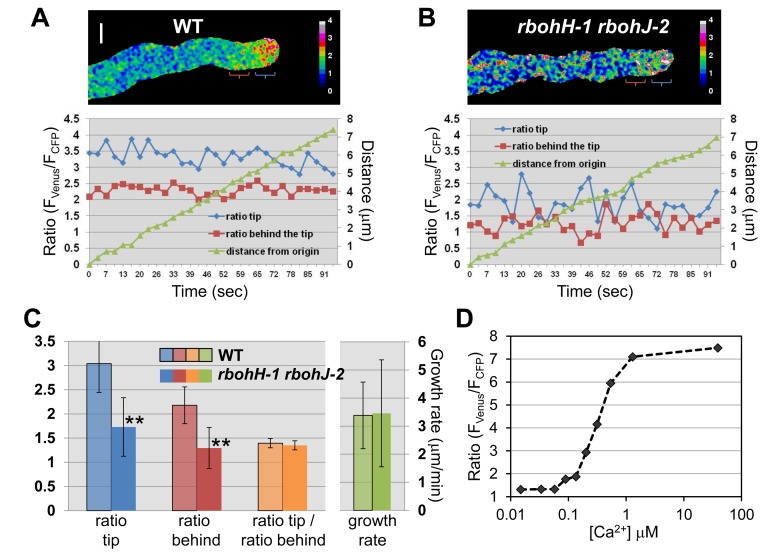
It has become increasingly apparent that the extracellular matrix (ECM), which in plants corresponds to the cell wall, can influence intracellular activities in ways that go far beyond their supposedly passive mechanical support. In plants, growing cells use mechanisms sensing cell wall integrity to coordinate cell wall performance with the internal growth machinery to avoid growth cessation or loss of integrity. How this coordination precisely works is unknown. Previously, we reported that in the tip-growing pollen tube the ANXUR receptor-like kinases (RLKs) of the CrRLK1L subfamily are essential to sustain growth without loss of cell wall integrity in Arabidopsis. Here, we show that over-expression of the ANXUR RLKs inhibits growth by over-activating exocytosis and the over-accumulation of secreted cell wall material. Moreover, the characterization of mutations in two partially redundant pollen-expressed NADPH oxidases coupled with genetic interaction studies demonstrate that the ANXUR RLKs function upstream of these NADPH oxidases. Using the H₂O₂-sensitive HyPer and the Ca²⁺-sensitive YC3.60 sensors in NADPH oxidase-deficient mutants, we reveal that NADPH oxidases generate tip-localized, pulsating H₂O₂ production that functions, possibly through Ca²⁺ channel activation, to maintain a steady tip-focused Ca²⁺ gradient during growth. Our findings support a model where ECM-sensing receptors regulate reactive oxygen species production, Ca²⁺ homeostasis, and exocytosis to coordinate ECM-performance with the internal growth machinery.


Conflict of interest statement

The authors have declared that no competing interests exist.

Figures

Figure 1
Figure 1. Over-expression of ANX RLKs inhibits pollen germination, pollen tube growth, and decreases male transmission efficiency.
(A) Quantification of PT length after 5 h of in vitro growth for WT, two ANX1-YFP and three ANX2-YFP independent T3 complemented lines, and four independent T3 ANX1-YFP and ANX2-YFP over-expression lines. Data represent mean values ± standard error of the mean (SEM) of three independent experiments with more than 40 PTs per genotype and experiment. Single and double asterisks indicate significant differences from the WT according to a Student's t test with p<0.05 and p<0.01, respectively. See also Figure S1A. (B) Overview images of pollen of ANX1-YFP complemented and over-expression lines grown in vitro for 5 h. Scale bar = 100 µm. (C) TEM of ANX1-YFP and ANX2-YFP for four independent over-expression lines. For each independent over-expression line, heterozygous T2 plants were crossed as pollen donor to the WT. More than 250 seeds resulting from each cross were grown on MS plates containing hygromycin and resistance was scored. TEM was calculated as 100*(resistant/sensitive) in percent. Asterisks denote significant difference from the expected 1∶1 ratio for normal transmission with p<0.0001 (two-tailed exact Fisher's test). (D) Quantification of YFP fluorescence at the apical PM of growing PTs for each ANX1-YFP and ANX2-YFP over-expression line. Data represent mean values ± standard deviation (SD) (n>19 tubes for each line). Asterisks indicate significant difference among each ANX1-YFP or each ANX2-YFP over-expressing line (one-way ANOVA test, p<0.01).
Figure 2
Figure 2. Over-expression of ANX RLKs triggers cell wall accumulation that leads to a cessation of pollen tube elongation and plasma membrane invagination.
(A) Representative single median plane images of a normally growing PT of an ANX1-YFP complemented line (left) and an arrested PT of ANX1-YFP over-expressing line with apical membrane invagination (right). The different filters are indicated on the left. Before imaging, PTs were treated for 5 min with germination liquid medium containing FM4-64 (2 µM). Scale bar = 5 µm. (B) Time-course imaging of the apical PM invagination of an ANX1-YFP over-expressing PT that ceased to elongate. PTs were treated as in (A). See also corresponding Video S1. Filters are indicated at the top. Scale bar = 5 µm. (C) Representative bright-field and YFP fluorescence images of ANX1-YFP complemented (left) and over-expressing (right) PTs treated with 0.01% Ruthenium red, which stains acidic pectins. Note that staining is restricted to the tip of growing complemented PT (left, arrow), while it accumulates inwards following the invaginated apical membrane in the over-expressing PT (right, arrows). Scale bar = 10 µm.
Figure 3
Figure 3. ANX RLK over-expressing pollen tubes do not exhibit endocytosis defects but display an increased rate of exocytosis.
(A) Representative single median plane images of a normally growing PT of the ANX1-YFP complemented line (top) and a slow growing PT of the ANX1-YFP over-expressing line (bottom) treated for 5 min with FM4-64 (2 µM). FM4-64 derived fluorescence was quantified in the apical PM (region 1) and the apical cytoplasm (region 2) for n>25 PTs of each line. Note that there are more endocytotic and secretory vesicles in the apical cytoplasm of over-expressing PTs. See also corresponding Video S2 and (B). Scale bar = 5 µm. (B) Quantitative analysis of relative FM4-64 fluorescence in the apical PM versus the apical cytoplasm in growing PTs of one ANX1-YFP complemented and two over-expressing lines. Data are presented as mean values ± standard deviation (SD) (n>25 each). Double asterisks indicate significant differences from the complemented line according to a Student's t test with p<0.01. (C) Representative time-course imaging of FRAP for a complemented (left) and an over-expressing growing PT (right). Refer to Video S3 for more examples. Scale bar = 5 µm. (D) Quantitative analysis of FRAP time-courses of growing PTs of the complemented line (left, n = 18) and two over-expressing lines (right, n>17 for each). Relative intensity of apical PM-localized ANX1-YFP compared with fluorescence prior to photobleaching was used to quantify the rate of fluorescence recovery. FRAP signals are shown as mean values ± SD. The relative intensity after recovery for 10 s after photobleaching (I10sec) is indicated. See also corresponding Table S1.
Figure 4
Figure 4. rbohH rbohJ mutant pollen display anxur-like phenotypes.
(A) Quantification of pollen germination and PT rupture percentages (top histogram) and seed per siliques (bottom histogram) for WT, single, and double rboh as well as anx1 anx2 mutant plants. Data are mean ± standard error of the mean (SEM) of three independent experiments with more than 150 pollen grains or ten siliques per genotype and experiment. (B) Representative overview images of WT and rbohH rbohJ pollen grown in vitro for 5 h. Up to 80% of germinated pollen from rbohH rbohJ ruptured with clear traces of cytoplasmic content that was released into the medium (top right), while the remaining germinated grains produce PTs that will burst later on (bottom right, arrowheads) as opposed to WT PTs that grow normally (bottom left). Scale bar = 50 µm. (C) Photographs of siliques from WT, rbohH rbohJ, and anx1 anx2 plants. Scale bar = 500 µm. (D) Representative images of aniline blue staining of a WT pistil pollinated with WT pollen (left), a rbohH rbohJ pistil with WT pollen (middle), and a WT pistil with rbohH rbohJ pollen (right). Eighteen hours after manual pollination, WT PTs (left and middle panels) had grown through the entire pistil to reach the female gametophytes. In contrast, most of the rbohH rbohJ mutant PTs (right) were arrested in the transmitting tract. White arrows indicate the tip of the longest PT. Scale bar = 5 mm.
Figure 5
Figure 5. ANX1-YFP over-expression phenotypes are dependent on functional RbohH and RbohJ.
(A) Quantification of pollen germination and PT rupture for rbohH-1 rbohJ-2, ANX1-YFP in WT (line #4), ANX1-YFP in anx1-2 anx2-2 (complemented line), and ANX1-YFP in rbohH-1 rbohJ-2 plants. Data are mean ± standard error of the mean (SEM) of three independent experiments with more than 150 pollen grains per genotype and experiment. (B) Representative time-course imaging of FRAP for a rbohH-1 rbohJ-2 PT expressing ANX1-YFP. Scale bar = 5 µm. (C) Quantitative analysis of FRAP time-courses for growing PTs of ANX1-YFP in rbohH-1 rbohJ-2 (n = 24). Relative intensity of apical PM-localized ANX1-YFP compared with fluorescence prior to photobleaching was used to quantify the rate of fluorescence recovery. FRAP signals are shown as mean values ± standard deviation (SD). The relative intensity after recovery for 10 s after photobleaching (I10sec) is indicated. See also corresponding Table S1.
Figure 6
Figure 6. H2O2-sensitive HyPer sensor ratiometric imaging shows that RbohH and RbohJ are responsible for H2O2 production at the tip of growing pollen tubes.
(A) Quantification of HyPer ratio (F488/F405) at the tip and further back in the shank of growing WT (n = 27) and rbohH-1 rbohJ-2 (n = 22) PTs. Data are shown as the mean of ratios over 90 seconds±standard deviation (SD). Double asterisks indicate significant differences from the WT according to a Student's t test with p<0.01. (B) Representative images of a growing WT PT expressing cytosolic HyPer and the corresponding histogram displaying the ratios (F488/F405) at the tip (blue line) and behind the tip (red line) over 90 s, as well as the travelled distance of the PT tip (green line). The blue and red parentheses indicate where the circles of 4 µm diameter were positioned for measurements at the tip and behind the tip, respectively. See corresponding Video S4. Scale bar = 5 µm. (C) Representative images of growing rbohH-1 rbohJ-2 PT expressing cytosolic HyPer. See (B) for details.
Figure 7
Figure 7. Ca2+-sensitive cameleon YC3.60 ratiometric imaging shows that [Ca2+]cyt levels are decreased and less steady in growing rbohH-1 rbohJ-2 pollen tubes.
(A) Representative images of growing WT PTs expressing cytosolic YC3.60 and the corresponding histogram displaying the ratios (FCFP/FVenus) at the PT tip (blue line) and behind the tip (red line) over 90 seconds, as well as the travelled distance of the PT tip (green line). On the ratiometric image, the blue and red parentheses indicate where the circles of 4 µm diameter were positioned for measurements at the PT tip and behind the tip, respectively. See also corresponding Video S6. Scale bar = 5 µm. (B) Representative images of growing rbohH-1 rbohJ-2 PTs expressing cytosolic YC3.60. For details, see (A). (C) Quantification of YC3.60 ratio (FCFP/FVenus) at the PT tip (blue bars) and just behind the tip (red bars), as well as the tip-focused Ca2+gradient (ratio at the tip/ratio behind the tip; orange bars) and growth rates (green bars) of growing WT (n = 46) and rbohH-1 rbohJ-2 (n = 30) PTs. Data are shown as the mean of ratios or growth rates over 90 seconds ±standard deviation (SD). Double asterisks indicate significant differences from the WT according to a Student's t test with p<0.01. (D) Titration curve for YC3.60.

References

    1. Brown NH (2011) Extracellular matrix in development: insights from mechanisms conserved between invertebrates and vertebrates. Cold Spring Harb Perspect Biol 3: pii. - PMC - PubMed
    1. Okayama H (2012) Cell cycle control by anchorage signaling. Cell Signal 24: 1599–1609. - PubMed
    1. Wolf S, Hématy K, Höfte H (2012) Growth control and cell wall signaling in plants. Annu Rev Plant Biol 63: 381–407. - PubMed
    1. Hématy K, Sado P-E, Van Tuinen A, Rochange S, Desnos T, et al. (2007) A receptor-like kinase mediates the response of Arabidopsis cells to the inhibition of cellulose synthesis. Curr Biol 17: 922–931. - PubMed
    1. Escobar-Restrepo J-M, Huck N, Kessler S, Gagliardini V, Gheyselinck J, et al. (2007) The FERONIA receptor-like kinase mediates male-female interactions during pollen tube reception. Science 317: 656–660. - PubMed

Publication types

LinkOut - more resources