

Global mortality estimates for the 2009 Influenza Pandemic from the GLaMOR project: a modeling study
- PMID: 24302890
- PMCID: PMC3841239
- DOI: 10.1371/journal.pmed.1001558
Global mortality estimates for the 2009 Influenza Pandemic from the GLaMOR project: a modeling study
Abstract
Background: Assessing the mortality impact of the 2009 influenza A H1N1 virus (H1N1pdm09) is essential for optimizing public health responses to future pandemics. The World Health Organization reported 18,631 laboratory-confirmed pandemic deaths, but the total pandemic mortality burden was substantially higher. We estimated the 2009 pandemic mortality burden through statistical modeling of mortality data from multiple countries.
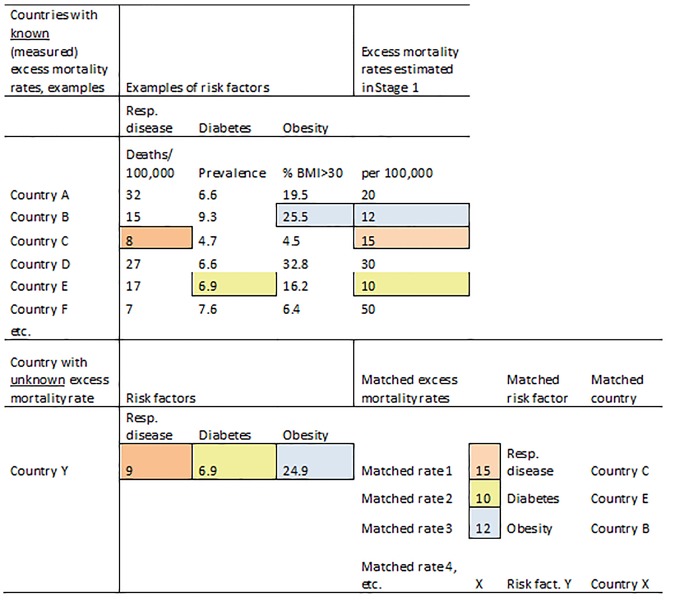
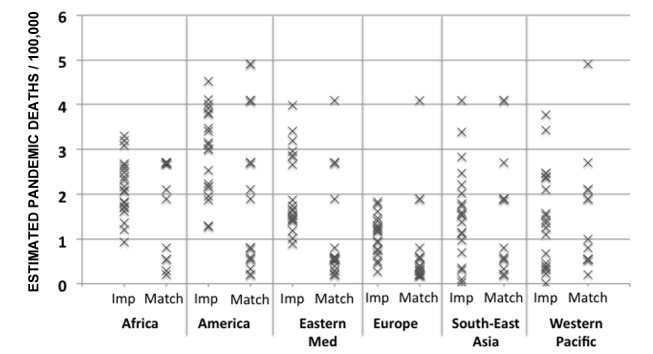
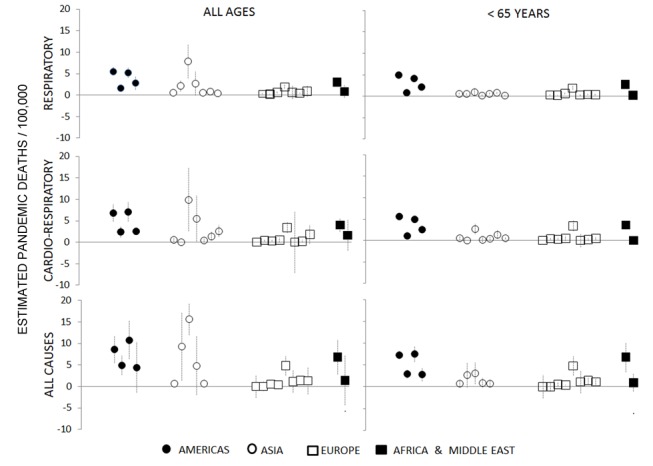
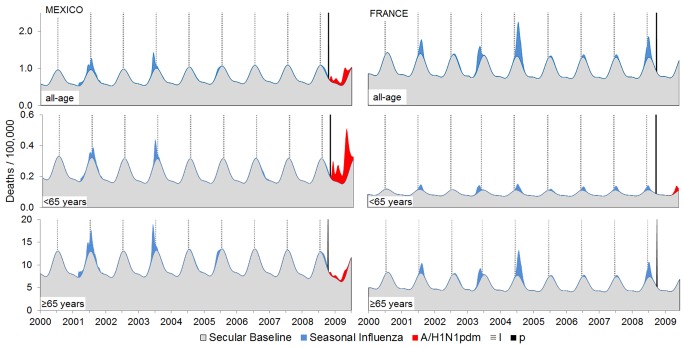
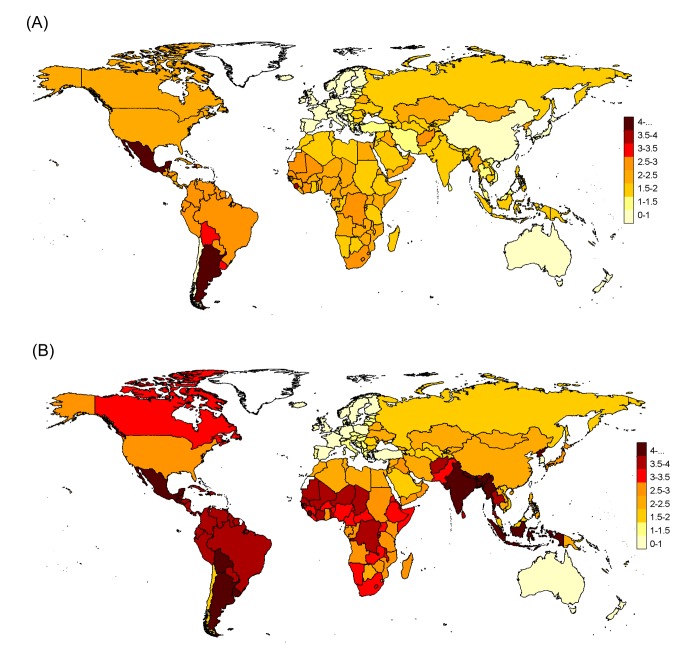
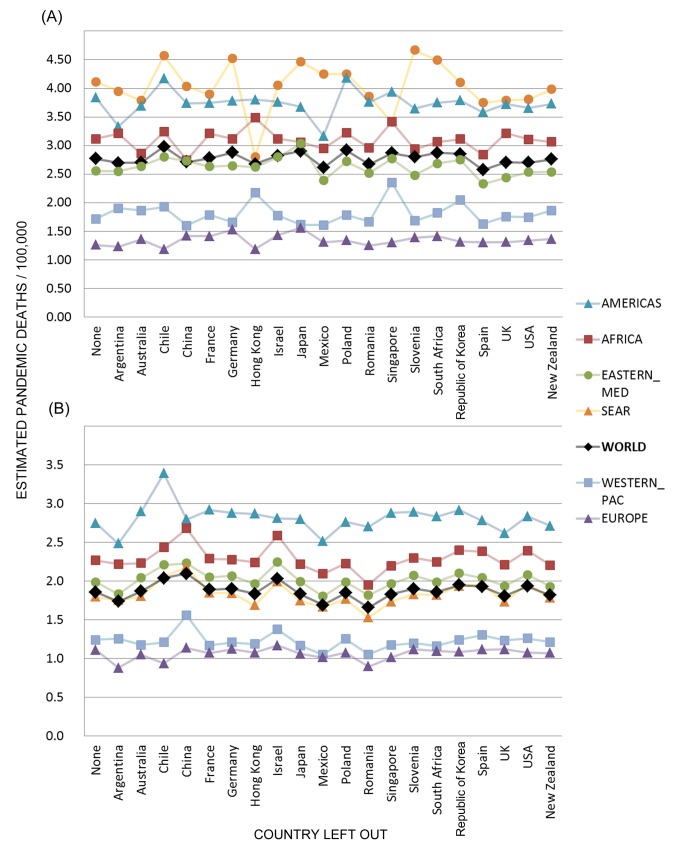
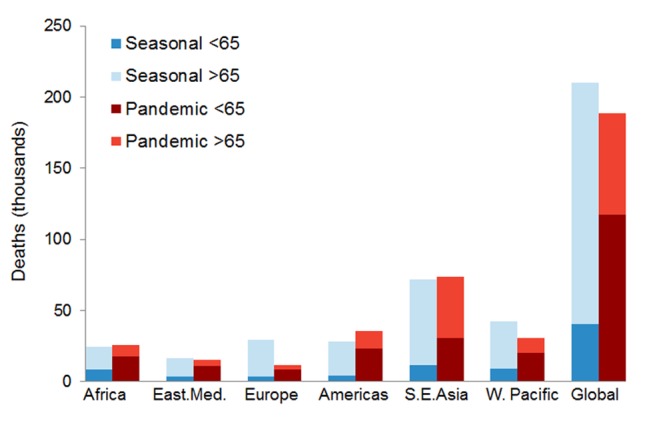
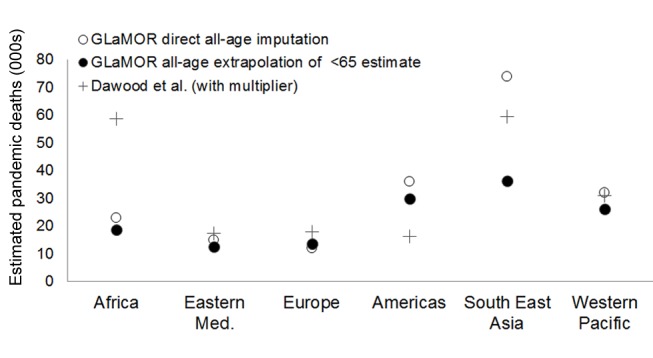
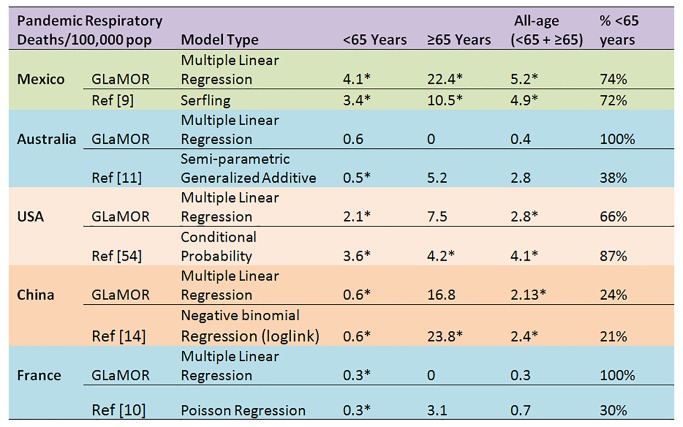
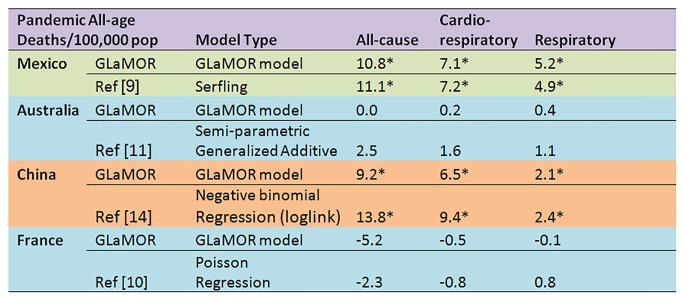
Methods and findings: We obtained weekly virology and underlying cause-of-death mortality time series for 2005-2009 for 20 countries covering ∼35% of the world population. We applied a multivariate linear regression model to estimate pandemic respiratory mortality in each collaborating country. We then used these results plus ten country indicators in a multiple imputation model to project the mortality burden in all world countries. Between 123,000 and 203,000 pandemic respiratory deaths were estimated globally for the last 9 mo of 2009. The majority (62%-85%) were attributed to persons under 65 y of age. We observed a striking regional heterogeneity, with almost 20-fold higher mortality in some countries in the Americas than in Europe. The model attributed 148,000-249,000 respiratory deaths to influenza in an average pre-pandemic season, with only 19% in persons <65 y. Limitations include lack of representation of low-income countries among single-country estimates and an inability to study subsequent pandemic waves (2010-2012).
Conclusions: We estimate that 2009 global pandemic respiratory mortality was ∼10-fold higher than the World Health Organization's laboratory-confirmed mortality count. Although the pandemic mortality estimate was similar in magnitude to that of seasonal influenza, a marked shift toward mortality among persons <65 y of age occurred, so that many more life-years were lost. The burden varied greatly among countries, corroborating early reports of far greater pandemic severity in the Americas than in Australia, New Zealand, and Europe. A collaborative network to collect and analyze mortality and hospitalization surveillance data is needed to rapidly establish the severity of future pandemics. Please see later in the article for the Editors' Summary.
Conflict of interest statement
LS has provided consultancy services to GlaxoSmithKline (GSK) and served on expert advisory boards for GSK, Roche, Pfizer, Merck, and Novartis. LS and RJT have an ownership interest in Sage Analytica, a consultancy in epidemiology and bioinformatics. DMF has provided consultancy services for GSK, Novartis, and MedImmune relating to influenza epidemiology and vaccine effectiveness and has been supported to attend international influenza meetings. WJP has served on an influenza advisory board for GSK.
Figures
Comment in
-
Coronavirus response: a focus on containment is still apt.Nature. 2020 Mar;579(7797):7. doi: 10.1038/d41586-020-00623-2. Nature. 2020. PMID: 32127714 No abstract available.
References
-
- World Health Organization (2010) Pandemic (H1N1) 2009—update 112. Available: http://www.who.int/csr/don/2010_08_06/en/index.html. Accessed 12 October 2012.
-
- Enserink M, Cohen J (2009) Virus of the year. The novel H1N1 influenza. Science 326: 1607. - PubMed
-
- Flynn P (2010) The handling of the H1N1 pandemic: more transparency needed. Council of Europe Parliamentary Assembly
-
- Simonsen L, Clarke MJ, Schonberger LB, Arden NH, Cox NJ, et al. (1998) Pandemic versus epidemic influenza mortality: a pattern of changing age distribution. J Infect Dis 178: 53–60. - PubMed
-
- Viboud C, Grais RF, Lafont BA, Miller MA, Simonsen L (2005) Multinational impact of the 1968 Hong Kong influenza pandemic: evidence for a smoldering pandemic. J Infect Dis 192: 233–248. - PubMed
Publication types
MeSH terms
Grants and funding
LinkOut - more resources
Full Text Sources
Other Literature Sources
Medical
