. 2013 Jul;1(2):e00016.
doi: 10.1002/phy2.16. Epub 2013 Jun 28.

Thermoregulatory, cardiovascular, and metabolic responses to mild caloric restriction in the Brown Norway rat

Affiliations

Thermoregulatory, cardiovascular, and metabolic responses to mild caloric restriction in the Brown Norway rat

Cenk Aydin et al. Physiol Rep. 2013 Jul.

Abstract

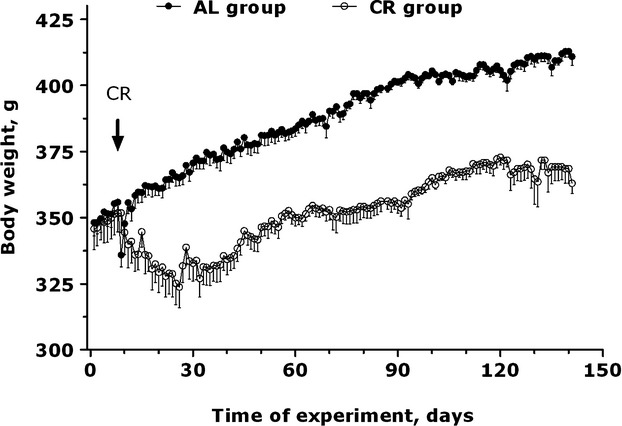
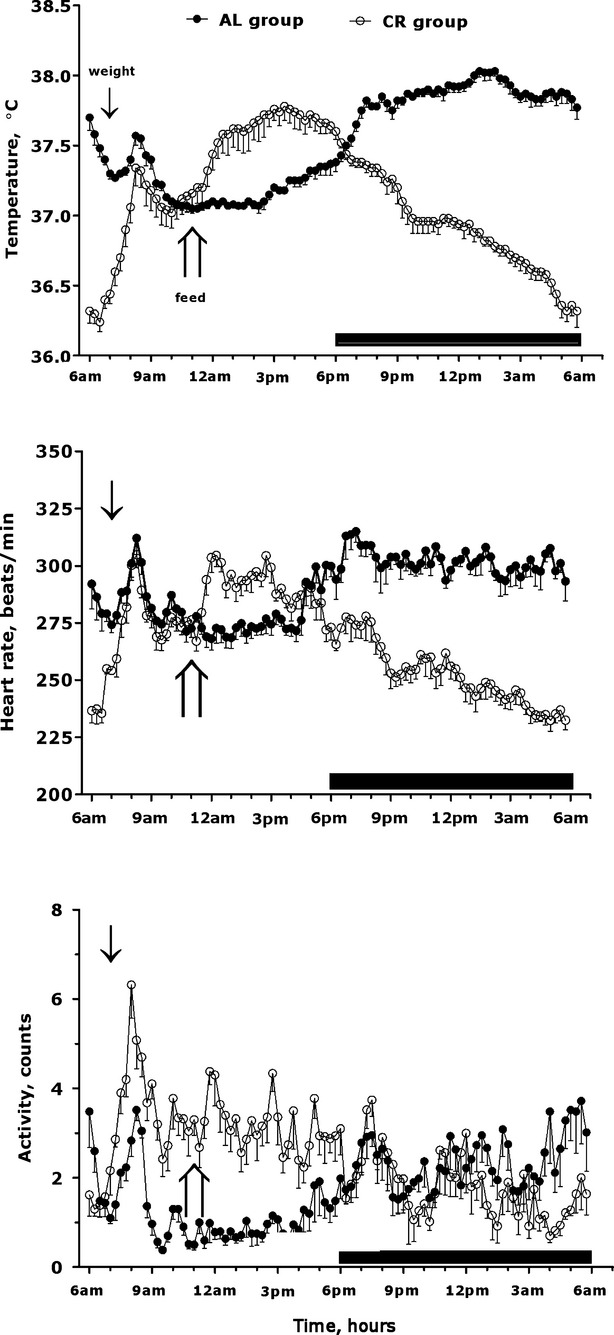
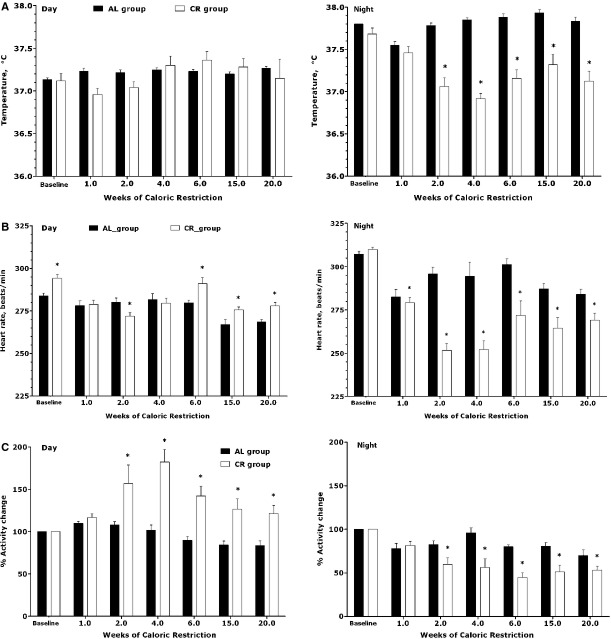
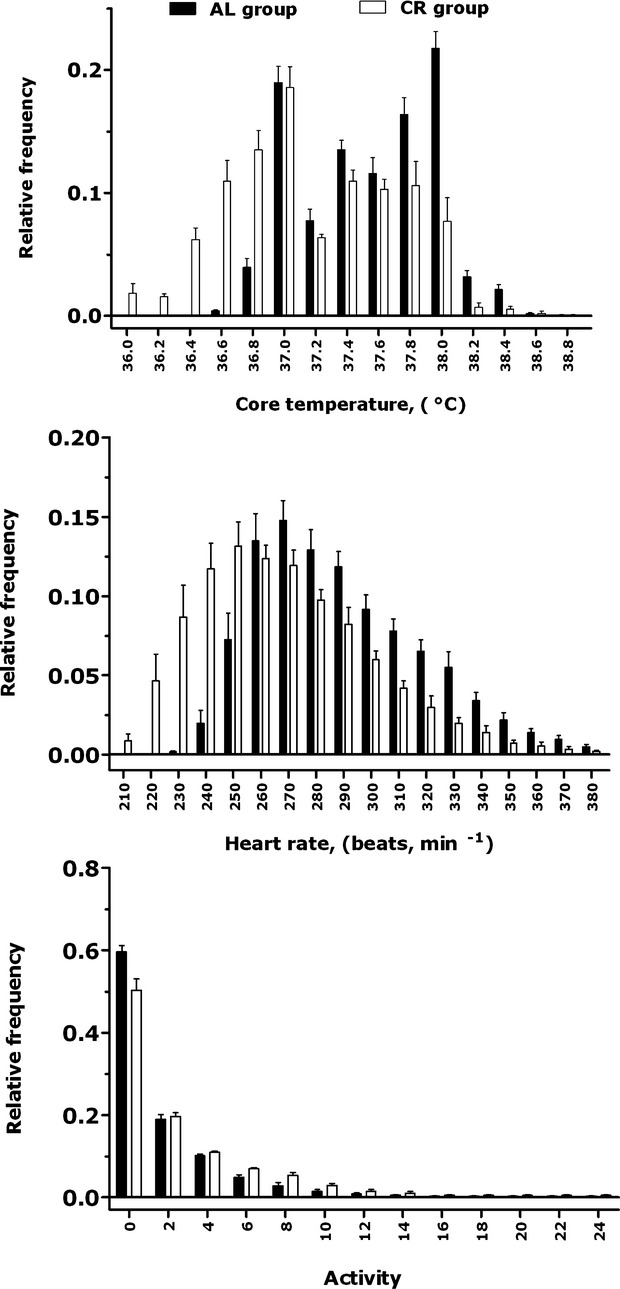
Caloric restriction (CR) has been demonstrated to prolong the life span of a variety of species. CR-induced reduction in core temperature (Tc) is considered a key mechanism responsible for prolonging life span in rodents; however, little is known about the regulation of CR-induced hypothermia as a function of the circadian cycle. We assessed how mild CR that resulted in a 10% reduction in body weight affected the 24 h patterns of Tc as well as heart rate (HR) and motor activity (MA) of the Brown Norway rat. Telemetered rats were allowed to feed for 20 weeks ad libitum (AL) or given a CR diet. Tc, HR, and MA of CR rats exhibited nocturnal reductions and diurnal elevations, opposite to that of AL rats. The effects of CR appeared to peak at ∼4 weeks. Metabolic rate (MR) and respiratory exchange ratio (RER) were measured overnight after 18 weeks of CR. MR and RER were elevated markedly at the time of feeding in CR rats and then declined during the night. We found that the pattern of Tc was altered with CR, characterized by elimination of high nocturnal Tc's typically observed in AL animals. In terms of mechanisms to prolong life span in CR animals, we suggest that the shift in the pattern of Tc during CR (i.e., elimination of high Tc's) may be as critical as the overall mean reduction in Tc. Future studies should address how the time of feeding may affect the thermoregulatory response in calorically restricted rats.

Keywords: Caloric restriction; longevity; metabolic rate; radiotelemetry; thermoregulation.


Figures

Figure 1
Figure 1
Time course of daily body weight for ad libitum (AL) and caloric restricted (CR) rats. Data plotted as mean ± SE (N = 6 for AL; N = 5 for CR). RMANOVA: treatment, F (1, 9) = 81.54, P < 0.001; day, F (154, 1386) = 63.42, P < 0.001; treatment × day, F (154, 1386) = 7.38, P < 0.001.
Figure 2
Figure 2
Example of telemetric recordings of core temperature, heart rate, and motor activity of a single rat prior to CR and on days 4–6 of CR. Small arrows indicate time of daily weighing at 07:00 am; large arrows indicate time of feeding at 11:00 am where rat is receiving ∼10 g of food per day.
Figure 3
Figure 3
Foldagrams for core temperature, heart rate, and motor activity of AL and CR groups during the fourth week of caloric restriction. Foldagrams represent 7 days of data averaged into 1 day for each rat. Data plotted as mean ± SE. Arrow symbols denote weighing and feeding (see Fig. 2).
Figure 4
Figure 4
(A) Time course of day and night time core temperature (A), over the course of 20 weeks of CR. Asterisks indicate significant difference when compared to ad lib fed animals compared at each time point. RMANOVA: Day: treatment, F (1, 9) = 0.0094, P < 0.92; week, F (7, 63) = 2.77, P < 0.014; treatment × week, F (7, 63) = 1.869, P < 0.090. Night: treatment, F (1, 9) = 32.83, P < 0.001; week, F (7, 63) = 5.56; treatment × week, F (7, 63) = 8.07, P < 0.001. (B) Time course of day and night time heart rate (B) over the course of 20 weeks of CR. Asterisks indicate significant difference when compared to ad lib fed animals compared at each time point. RMANOVA: Day: treatment, F(1,9) = 12.81, P = 0.006; week, F (7, 63) = 17.81, P < 0.001; treatment × week, F (7, 63) = 4.48, P < 0.001. Night: treatment, F (1, 9) = 34.62, P < 0.001; week, F (7, 63) = 16.95, P < 0.001; treatment × week, F (7, 63) = 10.61, P < 0.001. (C) Time course of day and night time motor activity (C) over the course of 20 weeks of CR. Asterisks indicate significant difference when compared to ad lib fed animals compared at each time point. RMANOVA: Day: treatment, F (1, 9) = 21.60, P < 0.001; week, F (7, 63) = 16.97, P < 0.001; treatment × week, F (7, 63) = 8.42, P < 0.001. Night: treatment, F (1, 9) = 22.76, P < 0.001; week, F (7, 63) = 12.94, P < 0.001; treatment × week, F (7, 63) = 5.14, P < 0.001.
Figure 5
Figure 5
(A) Time course of telemetry data (A–C) in the AL and CR housed in the calorimeter for 22 h (after 6 weeks of caloric restriction). Asterisks indicate significant difference when compared to ad lib fed animals compared at each time point. RMANOVA: Core Temperature: treatment, F (1, 9) = 1.09, P < 0.322; week, F (23, 207) = 96.35, P < 0.001; treatment × week, F (23, 207) = 5.76, P < 0.001. Heart Rate: treatment, F (1, 9) = 4.04, P < 0.075; week, F (23, 207) = 41.40, P < 0.001; treatment × week, F (23, 207) = 6.13, P < 0.001. Activity: treatment, F (1, 9) = 1.99, P < 0.191; week, F (23, 207) = 6.77, P < 0.001; treatment × week, F (23, 207) = 3.09, P < 0.001. (B) Time course of calorimetery measurements including metabolic rate (D) and respiratory exchange ratio (RER) (E) in the AL and CR housed in the calorimeter for 22 h (after 18 weeks of caloric restriction). Asterisks indicate significant difference when compared to ad lib fed animals compared at each time point. RMANOVA: Core Temperature: treatment, F (1, 9) = 1.09, P < 0.322; week, F (23, 207) = 96.35, P < 0.001; treatment × week, F (23, 207) = 5.76, P < 0.001. Heart Rate: treatment, F (1, 9) = 4.04, P < 0.075; week, F (23, 207) = 41.40, P < 0.001; treatment × week, F (23, 207) = 6.13, P < 0.001. Activity: treatment, F (1, 9) = 1.99, P < 0.191; week, F (23, 207) = 6.77, P < 0.001; treatment × week, F (23, 207) = 3.09, P < 0.001.
Figure 6
Figure 6
Frequency distribution of core temperature, heart rate, and motor activity during the fourth week of caloric restriction. Data plotted as mean ± SE. N = 6 for AL and N = 5 for CR.

References

    1. Ali JS, Olszyk VB, Lee KLA, Kendall SM, Rhoderick RR, Bushnell PJ. A lotus 1-2-3-based system for recording and maintaining body weight of laboratory animals. Behav. Res. Methods Instrum. Comput. 1992;24:82–87.
    1. Anderson RM, Shanmuganayagam D, Weindruch R. Caloric restriction and aging: studies in mice and monkeys. Toxicol. Pathol. 2009;37:47–51. - PMC - PubMed
    1. Bevilacqua L, Ramsey JJ, Hagopian K, Weindruch R, Harper ME. Long-term caloric restriction increases UCP3 content but decreases proton leak and reactive oxygen species production in rat skeletal muscle mitochondria. Am. J. Physiol. Endocrinol. Metab. 2005;289:E429–E438. - PubMed
    1. Bruss MD, Khambatta CF, Ruby MA, Aggarwal I, Hellerstein MK. Calorie restriction increases fatty acid synthesis and whole body fat oxidation rates. Am. J. Physiol. Endocrinol. Metab. 2010;298:E108–E116. - PMC - PubMed
    1. Dirks AJ, Leeuwenburgh C. Caloric restriction in humans: potential pitfalls and health concerns. Mech. Ageing Dev. 2006;127:1–7. - PubMed

LinkOut - more resources