Differential marker expression by cultures rich in mesenchymal stem cells
- PMID: 24304471
- PMCID: PMC4235221
- DOI: 10.1186/1471-2121-14-54
Differential marker expression by cultures rich in mesenchymal stem cells
Abstract
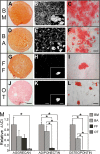
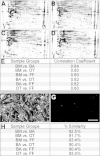
Background: Mesenchymal stem cells have properties that make them amenable to therapeutic use. However, the acceptance of mesenchymal stem cells in clinical practice requires standardized techniques for their specific isolation. To date, there are no conclusive marker (s) for the exclusive isolation of mesenchymal stem cells. Our aim was to identify markers differentially expressed between mesenchymal stem cell and non-stem cell mesenchymal cell cultures. We compared and contrasted the phenotype of tissue cultures in which mesenchymal stem cells are rich and rare. By initially assessing mesenchymal stem cell differentiation, we established that bone marrow and breast adipose cultures are rich in mesenchymal stem cells while, in our hands, foreskin fibroblast and olfactory tissue cultures contain rare mesenchymal stem cells. In particular, olfactory tissue cells represent non-stem cell mesenchymal cells. Subsequently, the phenotype of the tissue cultures were thoroughly assessed using immuno-fluorescence, flow-cytometry, proteomics, antibody arrays and qPCR.
Results: Our analysis revealed that all tissue cultures, regardless of differentiation potential, demonstrated remarkably similar phenotypes. Importantly, it was also observed that common mesenchymal stem cell markers, and fibroblast-associated markers, do not discriminate between mesenchymal stem cell and non-stem cell mesenchymal cell cultures. Examination and comparison of the phenotypes of mesenchymal stem cell and non-stem cell mesenchymal cell cultures revealed three differentially expressed markers - CD24, CD108 and CD40.
Conclusion: We indicate the importance of establishing differential marker expression between mesenchymal stem cells and non-stem cell mesenchymal cells in order to determine stem cell specific markers.
Figures


Similar articles
-
Identification and Evaluation of New Immunoregulatory Genes in Mesenchymal Stromal Cells of Different Origins: Comparison of Normal and Inflammatory Conditions.Med Sci Monit Basic Res. 2017 Mar 24;23:87-96. doi: 10.12659/msmbr.903518. Med Sci Monit Basic Res. 2017. PMID: 28336906 Free PMC article.
-
Isolation and characterization of mesenchymal stem cells from human umbilical cord blood: reevaluation of critical factors for successful isolation and high ability to proliferate and differentiate to chondrocytes as compared to mesenchymal stem cells from bone marrow and adipose tissue.J Cell Biochem. 2011 Apr;112(4):1206-18. doi: 10.1002/jcb.23042. J Cell Biochem. 2011. PMID: 21312238
-
Hepatogenic differentiation of human mesenchymal stem cells from adipose tissue in comparison with bone marrow mesenchymal stem cells.World J Gastroenterol. 2006 Sep 28;12(36):5834-45. doi: 10.3748/wjg.v12.i36.5834. World J Gastroenterol. 2006. PMID: 17007050 Free PMC article.
-
Functionally and phenotypically distinct subpopulations of marrow stromal cells are fibroblast in origin and induce different fates in peripheral blood monocytes.Stem Cells Dev. 2014 Apr 1;23(7):729-40. doi: 10.1089/scd.2013.0300. Epub 2013 Nov 23. Stem Cells Dev. 2014. PMID: 24131213 Free PMC article.
-
The characterisation of mesenchymal stem cells: a stem cell is not a stem cell is not a stem cell.J Stem Cells. 2012;7(2):87-95. J Stem Cells. 2012. PMID: 23550347 Review.
Cited by
-
GDAP1 Involvement in Mitochondrial Function and Oxidative Stress, Investigated in a Charcot-Marie-Tooth Model of hiPSCs-Derived Motor Neurons.Biomedicines. 2021 Aug 2;9(8):945. doi: 10.3390/biomedicines9080945. Biomedicines. 2021. PMID: 34440148 Free PMC article.
-
Research Advancements in Porcine Derived Mesenchymal Stem Cells.Curr Stem Cell Res Ther. 2016;11(1):78-93. doi: 10.2174/1574888x10666150723145911. Curr Stem Cell Res Ther. 2016. PMID: 26201864 Free PMC article. Review.
-
Multiparametric senescent cell phenotyping reveals targets of senolytic therapy in the aged murine skeleton.Nat Commun. 2023 Jul 31;14(1):4587. doi: 10.1038/s41467-023-40393-9. Nat Commun. 2023. PMID: 37524694 Free PMC article.
-
Distinct Shades of Adipocytes Control the Metabolic Roles of Adipose Tissues: From Their Origins to Their Relevance for Medical Applications.Biomedicines. 2021 Jan 5;9(1):40. doi: 10.3390/biomedicines9010040. Biomedicines. 2021. PMID: 33466493 Free PMC article. Review.
-
Olfactory Ecto-Mesenchymal Stem Cells in Modeling and Treating Alzheimer's Disease.Int J Mol Sci. 2024 Aug 3;25(15):8492. doi: 10.3390/ijms25158492. Int J Mol Sci. 2024. PMID: 39126059 Free PMC article. Review.
References
-
- Friedenstein AJ, Chailakhjan RK, Lalykina KS. The development of fibroblast colonies in monolayer cultures of guinea-pig bone marrow and spleen cells. Cell Tissue Kinet. 1970;3(4):393–403. - PubMed
-
- Williams JT, Southerland SS, Souza J, Calcutt AF, Cartledge RG. Cells isolated from adult human skeletal muscle capable of differentiating into multiple mesodermal phenotypes. Am Surg. 1999;65(1):22–26. - PubMed
Publication types
MeSH terms
Substances
LinkOut - more resources
Full Text Sources
Other Literature Sources
Research Materials

