

Phage infection of an environmentally relevant marine bacterium alters host metabolism and lysate composition
- PMID: 24304672
- PMCID: PMC3996693
- DOI: 10.1038/ismej.2013.216
Phage infection of an environmentally relevant marine bacterium alters host metabolism and lysate composition
Abstract
Viruses contribute to the mortality of marine microbes, consequentially altering biological species composition and system biogeochemistry. Although it is well established that host cells provide metabolic resources for virus replication, the extent to which infection reshapes host metabolism at a global level and the effect of this alteration on the cellular material released following viral lysis is less understood. To address this knowledge gap, the growth dynamics, metabolism and extracellular lysate of roseophage-infected Sulfitobacter sp. 2047 was studied using a variety of techniques, including liquid chromatography-tandem mass spectrometry (LC-MS/MS)-based metabolomics. Quantitative estimates of the total amount of carbon and nitrogen sequestered into particulate biomass indicate that phage infection redirects ∼75% of nutrients into virions. Intracellular concentrations for 82 metabolites were measured at seven time points over the infection cycle. By the end of this period, 71% of the detected metabolites were significantly elevated in infected populations, and stable isotope-based flux measurements showed that these cells had elevated metabolic activity. In contrast to simple hypothetical models that assume that extracellular compounds increase because of lysis, a profile of metabolites from infected cultures showed that >70% of the 56 quantified compounds had decreased concentrations in the lysate relative to uninfected controls, suggesting that these small, labile nutrients were being utilized by surviving cells. These results indicate that virus-infected cells are physiologically distinct from their uninfected counterparts, which has implications for microbial community ecology and biogeochemistry.
Figures
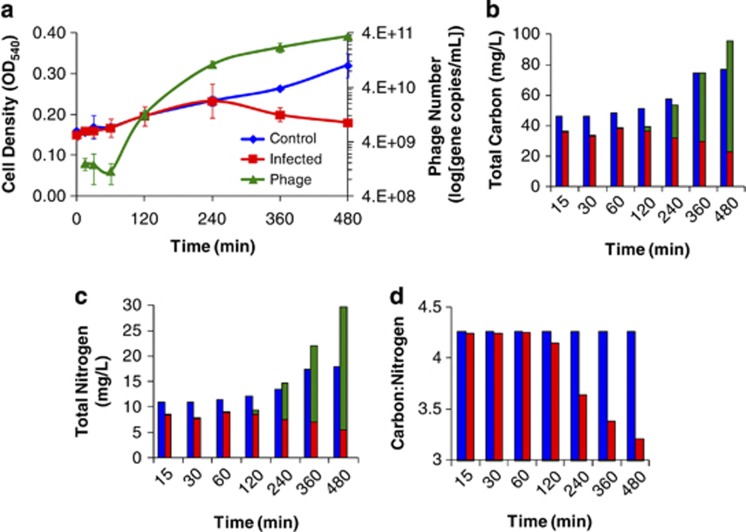
 ), control culture (
 ) and phage numbers (
 ). Turbidity declines are indicative of phage-induced lysis. Phage numbers were derived from qPCR assays. Averages and ranges of biological duplicates are reported. Estimates of (b) carbon and (c) nitrogen content and their (d) ratios for Sulfitobacter sp. 2047 cells and phage during an infection cycle. Bar graphs are color coded as follows: phage (
 ), infected culture (
 ) and control culture (
 ). Bacterial cell densities were determined by microscopy. Phage numbers were determined using qPCR. Bacterial carbon (149 fg C per cell) and nitrogen (35 fg N per cell) were derived from literature values of marine bacteria as reported in text. Phage carbon (0.2 fg C per phage) and nitrogen (0.076 fg N per phage) were derived from theoretical calculations (Jover et al., 2014). Values reflect the average of duplicate biological replicates.
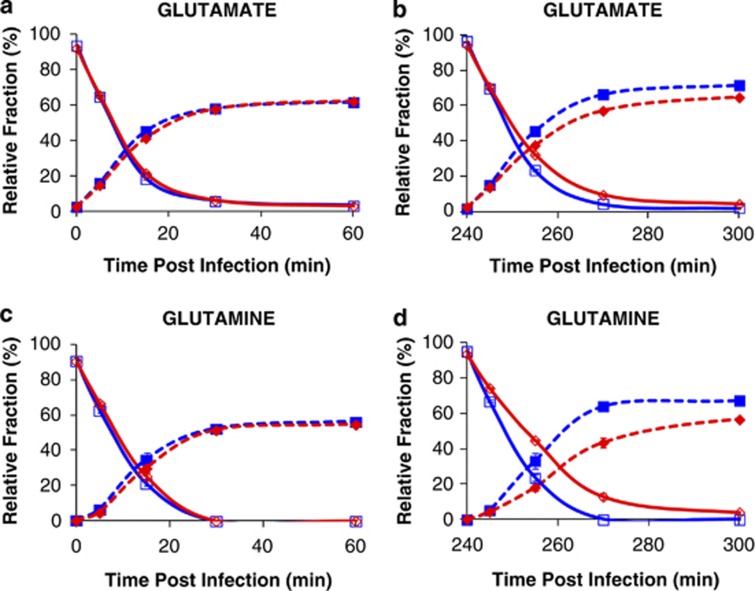
 ) and control (
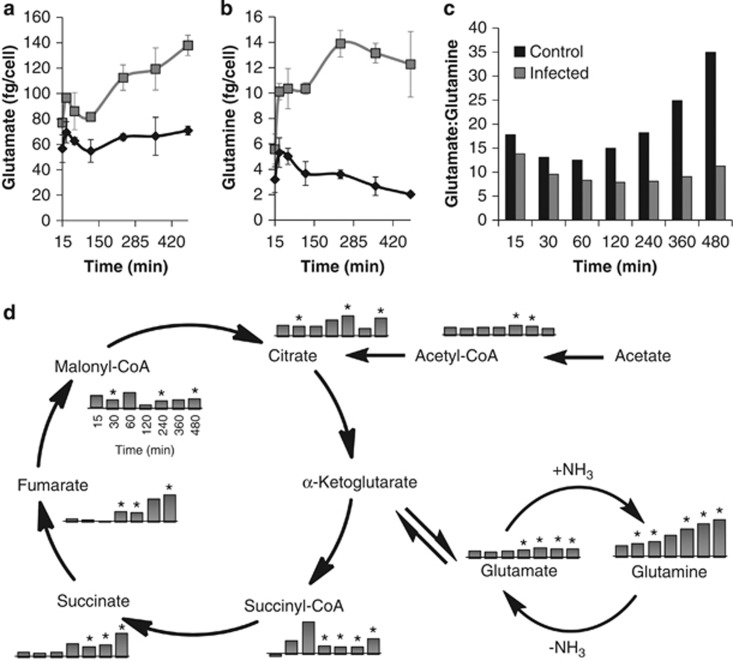
 ) populations as well as the appearance of fully 13C-labeled metabolites in phage-infected (
 ) and control (
 ) populations. Error bars represent range of the data and are obscured by the data markers, in some cases.
References
-
- Bajad SU, Lu W, Kimball EH, Yuan J, Peterson C, Rabinowitz JD. Separation and quantitation of water soluble cellular metabolites by hydrophilic interaction chromatography-tandem mass spectrometry. J Chromatogr. 2006;1125:76–88. - PubMed
-
- Bancroft FC, Freifelder D. Molecular weights of coliphages and coliphage DNA. J Mol Biol. 1970;54:537–546. - PubMed
Publication types
MeSH terms
Substances
LinkOut - more resources
Full Text Sources
Other Literature Sources
Miscellaneous
