

Dynamics of tissue topology during cancer invasion and metastasis
- PMID: 24304856
- PMCID: PMC4324506
- DOI: 10.1088/1478-3975/10/6/065003
Dynamics of tissue topology during cancer invasion and metastasis
Abstract
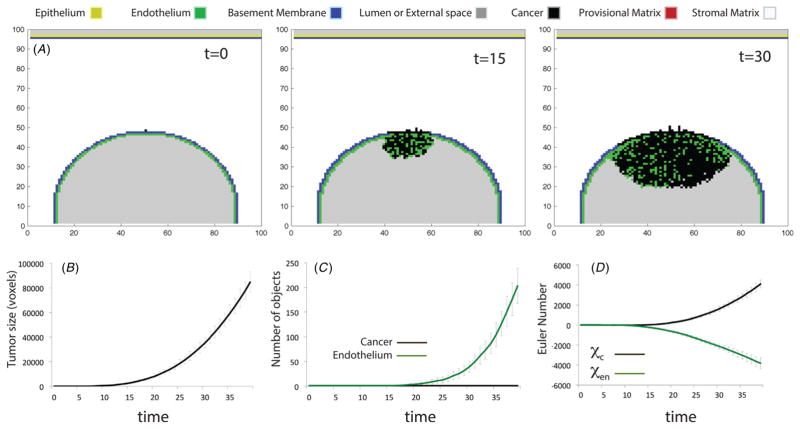
During tumor progression, cancer cells mix with other cell populations including epithelial and endothelial cells. Although potentially important clinically as well as for our understanding of basic tumor biology, the process of mixing is largely a mystery. Furthermore, there is no rigorous, analytical measure available for quantifying the mixing of compartments within a tumor. I present here a mathematical model of tissue repair and tumor growth based on collective cell migration that simulates a wide range of observed tumor behaviors with correct tissue compartmentalization and connectivity. The resulting dynamics are analyzed in light of the Euler characteristic number (χ), which describes key topological features such as fragmentation, looping and cavities. The analysis predicts a number of regimes in which the cancer cells can encapsulate normal tissue, form a co-interdigitating mass, or become fragmented and encapsulated by endothelial or epithelial structures. Key processes that affect the topological changes are the production of provisional matrix in the tumor, and the migration of endothelial or epithelial cells on this matrix. Furthermore, the simulations predict that topological changes during tumor invasion into blood vessels may contribute to metastasis. The topological analysis outlined here could be useful for tumor diagnosis or monitoring response to therapy and would only require high resolution, 3D image data to resolve and track the various cell compartments.
Figures


Similar articles
-
The matrix environmental and cell mechanical properties regulate cell migration and contribute to the invasive phenotype of cancer cells.Rep Prog Phys. 2019 Jun;82(6):064602. doi: 10.1088/1361-6633/ab1628. Epub 2019 Apr 4. Rep Prog Phys. 2019. PMID: 30947151 Review.
-
Epithelial-mesenchymal transition in tumor metastasis.Mol Oncol. 2017 Jan;11(1):28-39. doi: 10.1002/1878-0261.12017. Epub 2016 Dec 9. Mol Oncol. 2017. PMID: 28085222 Free PMC article. Review.
-
Migratory neighbors and distant invaders: tumor-associated niche cells.Genes Dev. 2008 Mar 1;22(5):559-74. doi: 10.1101/gad.1636908. Genes Dev. 2008. PMID: 18316475 Free PMC article. Review.
-
A Genuinely Hybrid, Multiscale 3D Cancer Invasion and Metastasis Modelling Framework.Bull Math Biol. 2024 Apr 25;86(6):64. doi: 10.1007/s11538-024-01286-0. Bull Math Biol. 2024. PMID: 38664343 Free PMC article.
-
Low doses of ionizing radiation promote tumor growth and metastasis by enhancing angiogenesis.PLoS One. 2010 Jun 21;5(6):e11222. doi: 10.1371/journal.pone.0011222. PLoS One. 2010. PMID: 20574535 Free PMC article.
Cited by
-
Implantable tissue isolation chambers for analyzing tumor dynamics in vivo.Lab Chip. 2016 May 21;16(10):1840-51. doi: 10.1039/c6lc00237d. Epub 2016 Apr 29. Lab Chip. 2016. PMID: 27128791 Free PMC article.
-
Invasion front dynamics of interactive populations in environments with barriers.Sci Rep. 2022 Jan 17;12(1):826. doi: 10.1038/s41598-022-04806-x. Sci Rep. 2022. PMID: 35039586 Free PMC article.
-
Renin-angiotensin system inhibitor use and colorectal cancer risk and mortality: A dose-response meta analysis.J Renin Angiotensin Aldosterone Syst. 2020 Jul-Sep;21(3):1470320319895646. doi: 10.1177/1470320319895646. J Renin Angiotensin Aldosterone Syst. 2020. PMID: 32627649 Free PMC article.
References
-
- Baish JW, Jain RK. Fractals and cancer. Cancer Res. 2000;60:3683–8. - PubMed
-
- Block M, Scholl E, Drasdo D. Classifying the expansion kinetics and critical surface dynamics of growing cell populations. Phys Rev Lett. 2007;99:248101. - PubMed
-
- Carlsson G. Topology and data. Bull Am Math Soc. 2009;46:255–308.
-
- Chaplain MA, Sleeman BD. A mathematical model for the growth and classification of a solid tumor: a new approach via nonlinear elasticity theory using strain-energy functions. Math Biosci. 1992;111:169–215. - PubMed
-
- Chignola R, Del Fabbro A, Pellegrina CD, Milotti E. Ab initio phenomenological simulation of the growth of large tumor cell populations. Phys Biol. 2007;4:114–33. - PubMed
MeSH terms
Grants and funding
LinkOut - more resources
Full Text Sources
Other Literature Sources