. 2014 Mar;85(3):611-23.
doi: 10.1038/ki.2013.462. Epub 2013 Dec 4.

Regulation of lipid accumulation by AMP-activated kinase [corrected] in high fat diet-induced kidney injury

Affiliations

Regulation of lipid accumulation by AMP-activated kinase [corrected] in high fat diet-induced kidney injury

Anne-Emilie Declèves et al. Kidney Int. 2014 Mar.

Erratum in

Abstract

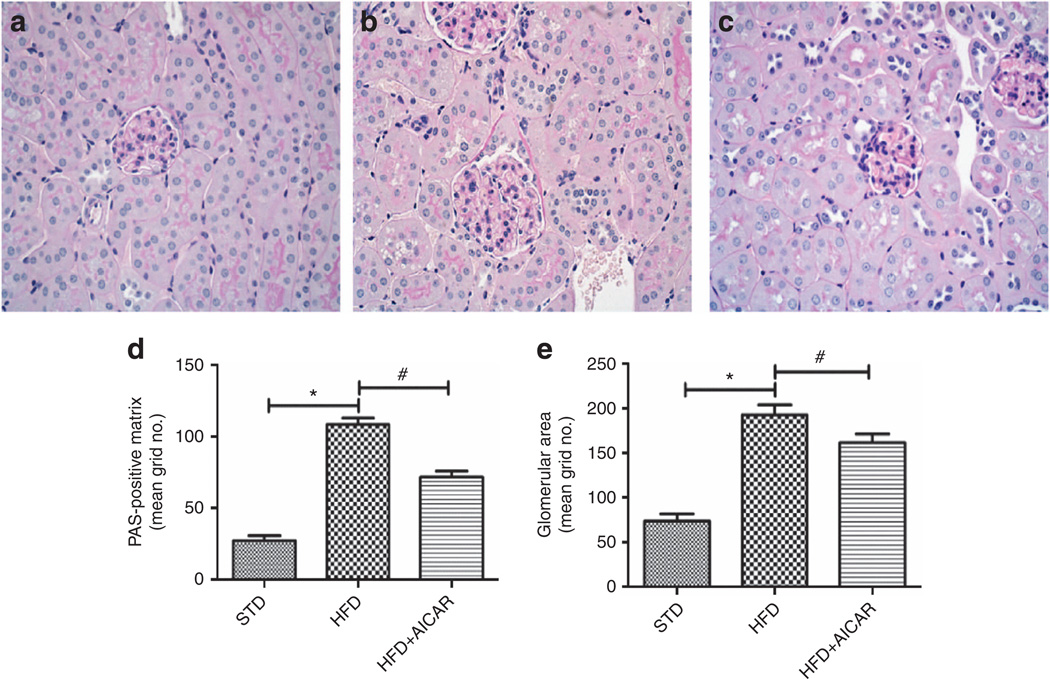
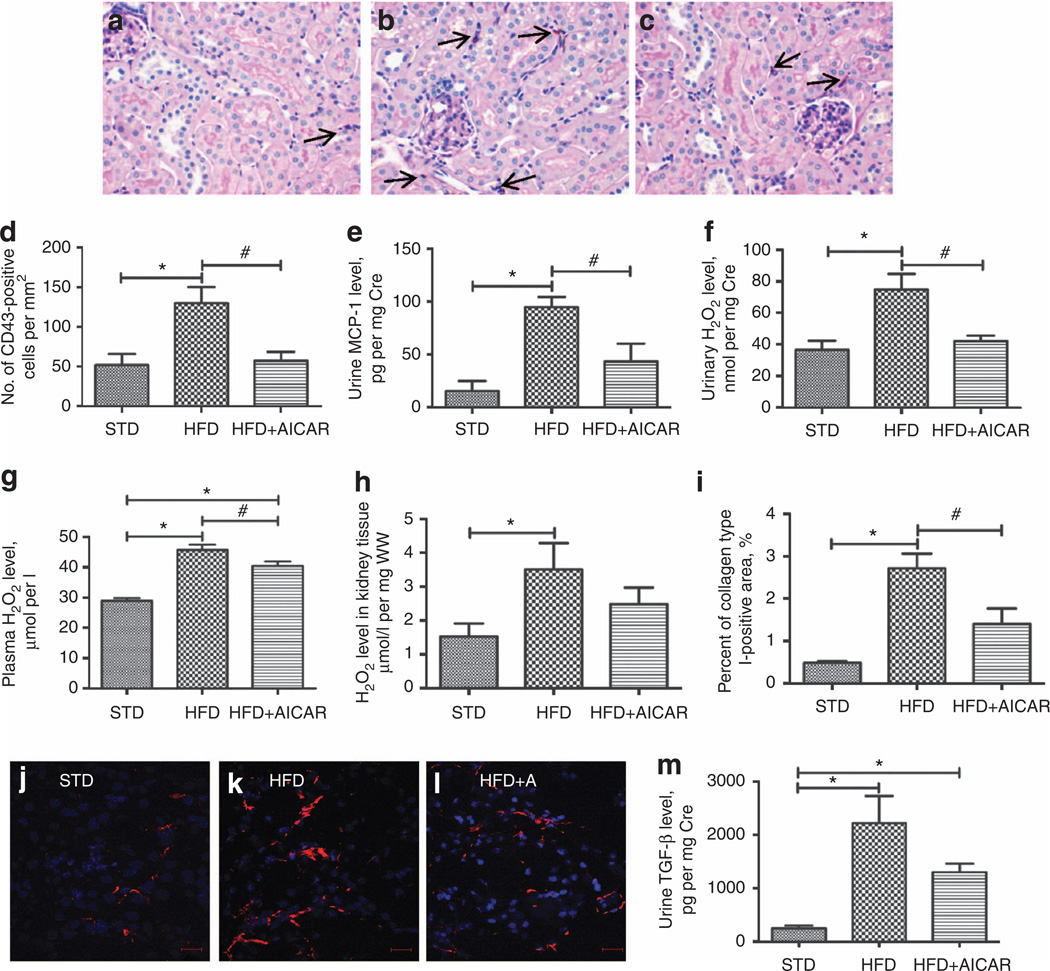
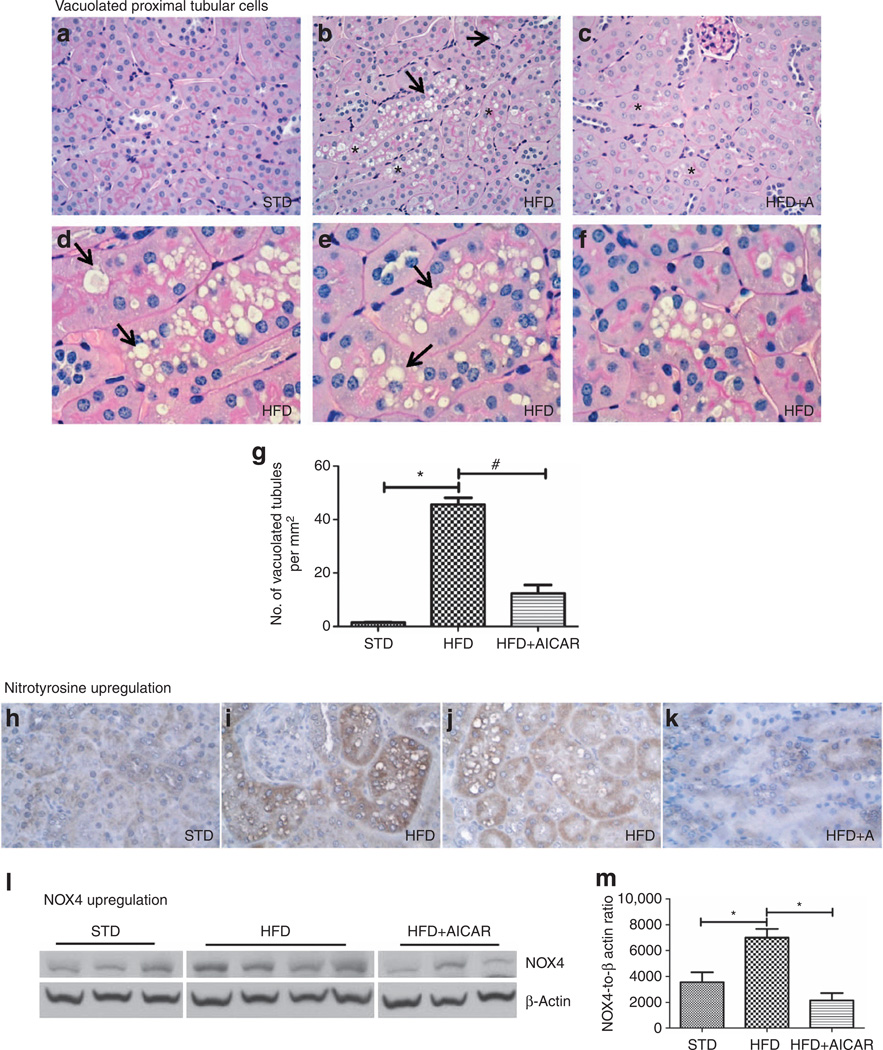
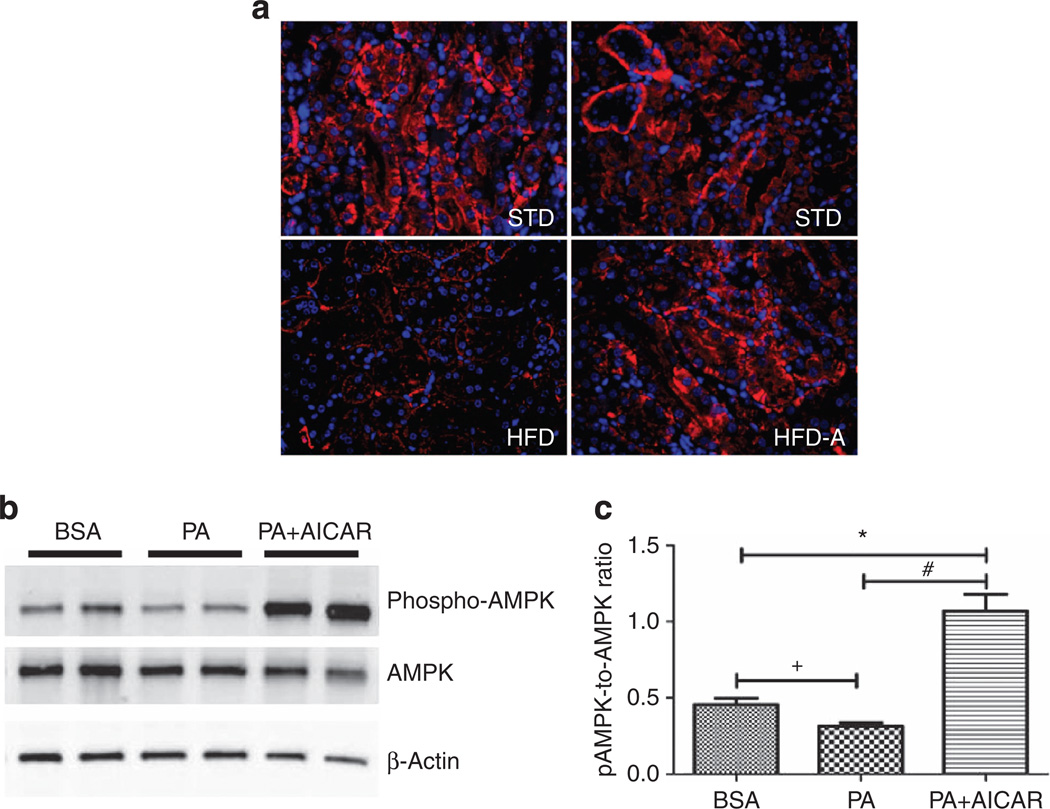
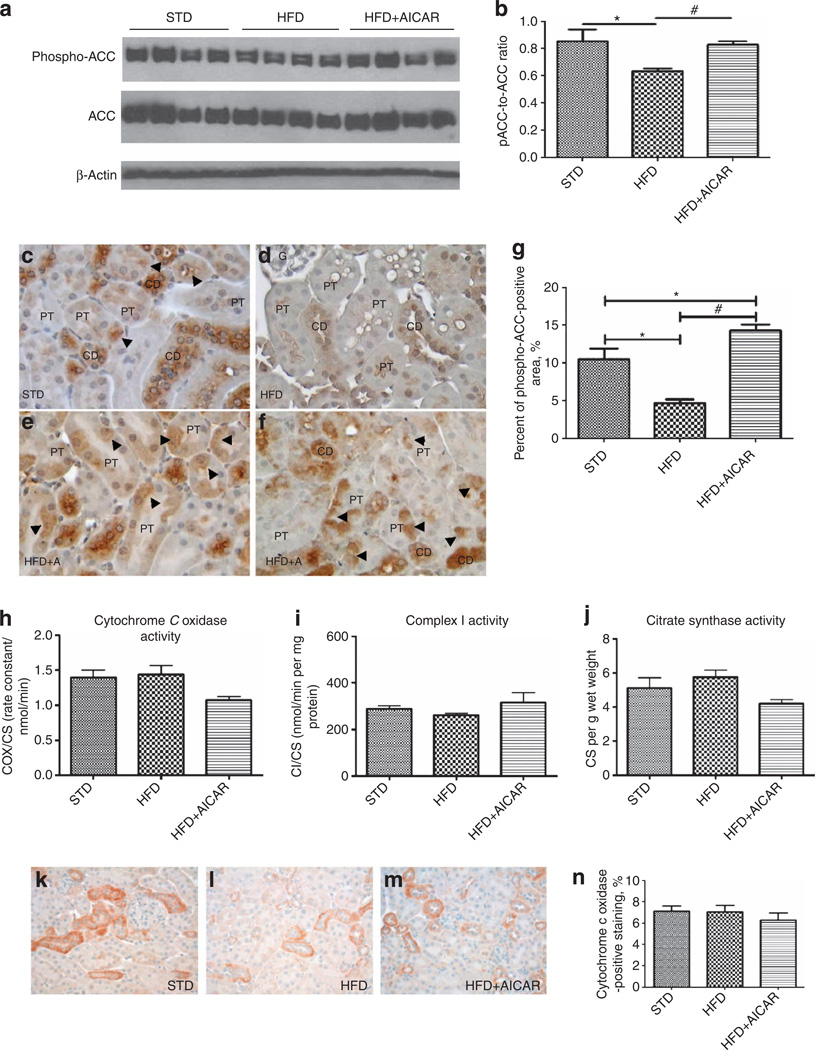
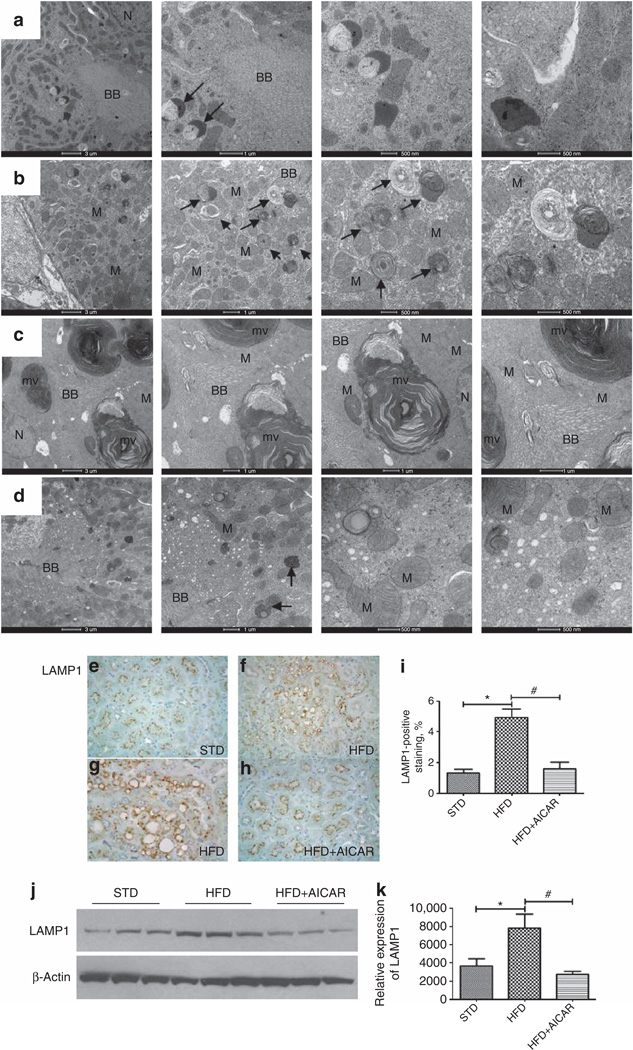
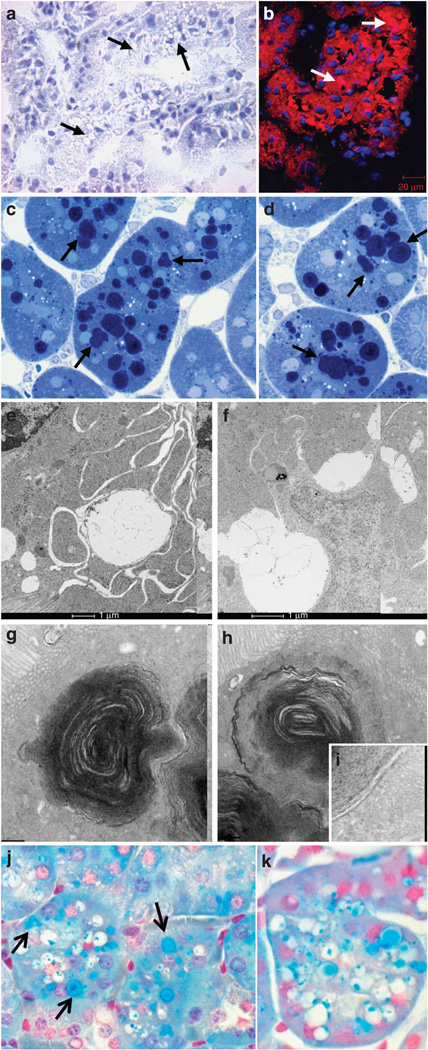
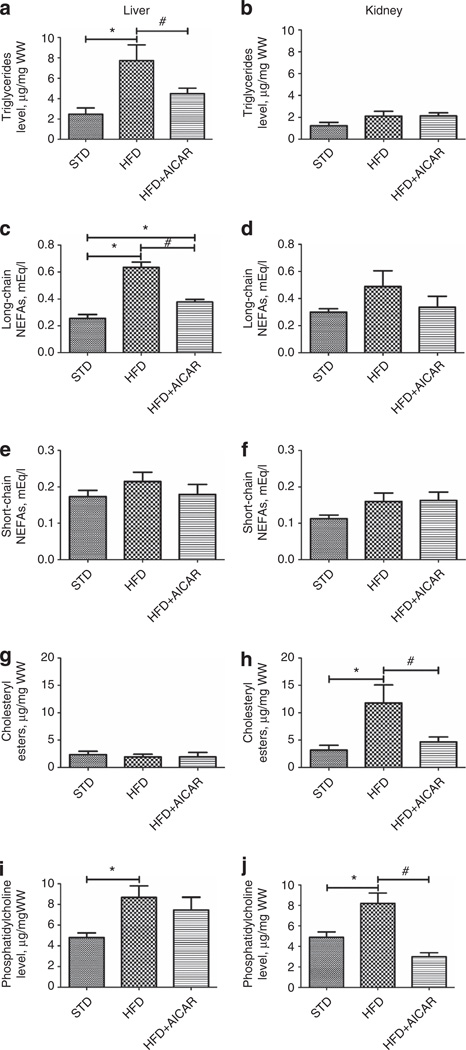
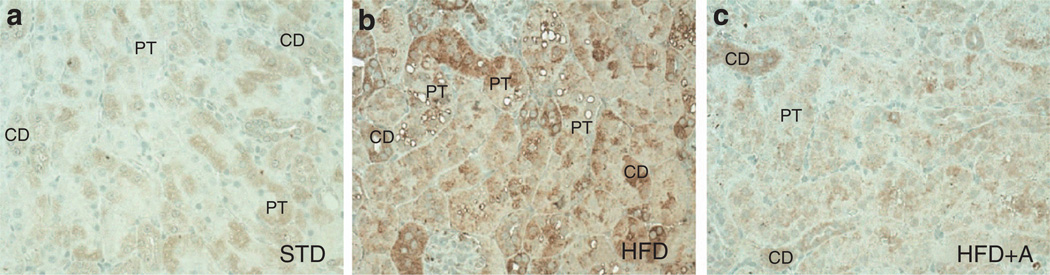
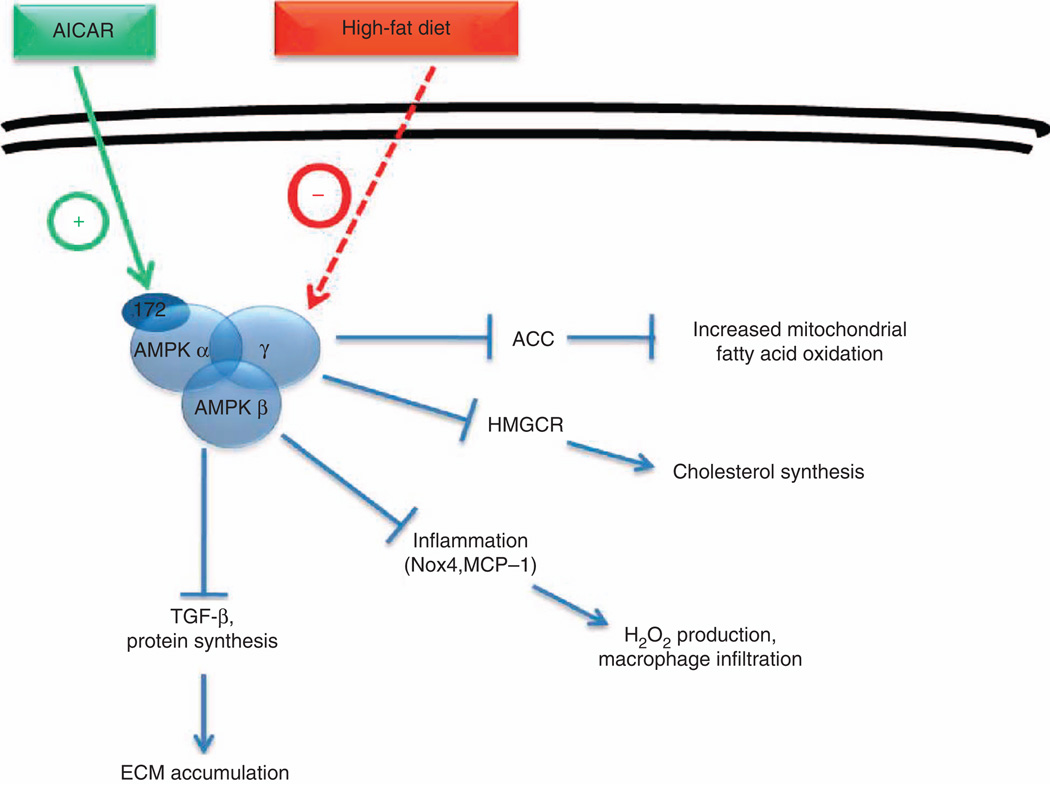
AMP-activated protein kinase (AMPK) is an important energy sensor that may be critical in regulating renal lipid accumulation. To evaluate the role of AMPK in mediating renal lipid accumulation, C57BL/6J mice were randomized to a standard diet, a high-fat diet, or a high-fat diet plus AICAR (an AMPK activator) for 14 weeks. Renal functional and structural studies along with electron microscopy were performed. Mice given the high-fat diet had proximal tubule injury with the presence of enlarged clear vacuoles, and multilaminar inclusions concurrent with an increase of tissue lipid and overloading of the lysosomal system. The margins of the clear vacuoles were positive for the endolysosomal marker, LAMP1, suggesting lysosome accumulation. Characterization of vesicles by special stains (Oil Red O, Nile Red, Luxol Fast Blue) and by electron microscopy showed they contained onion skin-like accumulations consistent with phospholipids. Moreover, cholesteryl esters and phosphatidylcholine-containing phospholipids were significantly increased in the kidneys of mice on a high-fat diet. AMPK activation with chronic AICAR treatment prevented the clinical and structural effects of high-fat diet. Thus, high-fat diet contributes to a dysfunction of the lysosomal system and altered lipid metabolism characterized by cholesterol and phospholipid accumulation in the kidney. AMPK activation normalizes the changes in renal lipid content despite chronic exposure to lipid challenge.


Figures

Figure 1
Figure 1. Effects of AMP-activated protein kinase (AMPK) activation on glomerular expansion from mice on standard diet (STD), high-fat diet (HFD), and HFD + AICAR
Representative photomicrographs (original magnification ×400) illustrating glomerular pathological features with periodic acid–Schiff (PAS) staining in (a) STD, (b) HFD, and (c) HFD + AICAR mice. Quantitative analysis of (d) glomerular surface area and (e) glomerular matrix at week 14. Values are means ±s.e.m. N = 6 in each group. Statistical analyses were performed by one-way analysis of variance (ANOVA) followed by Newman–Keuls, *P ≤ 0.05 versus mice on STD and #P ≤ 0.05 versus mice on HFD. AICAR, 5-aminoimidazole-4-carboxamide-1-β-d-ribofuranoside.
Figure 2
Figure 2. Effect of AMP-activated protein kinase (AMPK) activation on tubulointerstitial injury
Representative photomicrographs (original magnification ×400) of macrophage staining (CD43-positive cells, arrow) in (a) standard diet (STD), (b) high-fat diet (HFD), and (c) HFD + AICAR mice, (d) Quantitative analysis of number of CD43-positive cells per mm2 in mice on STD, HFD, or HFD + AICAR at 14 weeks, (e) Quantitative urine monocyte chemoattractant protein-1 (MCP-1) level in mice on STD, HFD, or HFD + AICAR. (f) Quantitative urine hydrogen peroxide (H2O2)/creatinine level in mice on STD, HFD, or HFD + AICAR. (g) Quantitative plasma H2O2 level in mice on STD, HFD, or HFD + AICAR. (h) Quantitative kidney tissue H2O2 per mg of wet kidney tissue level (WW) in mice on STD, HFD, or HFD + AICAR. (i) Quantitative analysis of percent of collagen type I–positive area in mice on STD, HFD, or HFD + AICAR at 14 weeks. Immunofluorescence microscopy of tubulointerstitial area sections illustrating collagen type I deposits in (j) STD, (k) HFD, and (I) HFD + AICAR mice, (m) Quantitative urine transforming growth factor-β (TGF-β) level in mice on STD, HFD, or HFD + AICAR. Values are means ±s.e.m. N = 6 in each group. Statistical analyses were performed by one-way analysis of variance (ANOVA) followed by Newman-Keuls, *P ≤ 0.05 versus mice on STD and #P ≤ 0.05 versus mice on HFD. AICAR, 5-aminoimidazole-4-carboxamide-1-β-d-ribofuranoside.
Figure 3
Figure 3. Effects of AMP-activated protein kinase (AMPK) activation on tubular histology from mice on standard diet (STD), high-fat diet (HFD), and HFD + AICAR
Representative photomicrographs (original magnification ×400) illustrating vacuolated proximal convoluted tubular cells (*) and loss of brush border (arrow) in (a) STD, (b) HFD, and (c) HFD + AICAR mice. Representative photomicrographs (original magnification ×1000) illustrating vacuolated proximal convoluted tubular cells (*) and impaired brush border (arrow) in (d–f) HFD mice. (g) Quantitative analysis of number of vacuolated tubules per mm2. Representative photomicrographs (original magnification ×400) illustrating nitrotyrosine staining in tubular epithelial cells in (h) STD, (i, j) HFD, and (k) HFD + AICAR. (I) Western blot analysis of the effect of HFD on NADPH oxidase 4 (NOX4) expression in STD-, HFD-, and HFD +AlCAR-treated mice, (m) Relative densitometry of the immunoblot shows that NOX4 was upregulated with HFD, whereas the AMPK activation prevented this rise. Values are means ±s.e.m. N = 6 in each group. Statistical analyses were performed by one-way analysis of variance (ANOVA) followed by Newman–Keuls, *P ≤ 0.05 versus mice on STD and #P ≤ 0.05 versus mice on HFD. AICAR, 5-aminoimidazole-4-carboxamide-1-β-d-ribofuranoside.
Figure 4
Figure 4. Effect of AICAR on AMP-activated kinase activation in renal tubular cells
Representative immunofluorescence photomicrographs (original magnification ×400) illustrating phosphorylated AMP-activated protein kinase (AMPK) staining in kidney tissue in (a) standard diet (STD), high-fat diet (HFD), and HFD +AICAR. (b) Western blot analysis of phospho-AMPK and AMPK in human renal proximal tubular epithelial cells (HRPTEpiC) treated respectively with bovine serum albumin (BSA), palmitic acid (PA), or PA + AICAR in order to mimic the HFD model. (c) Relative densitometry of the immunoblot shows that phospho-AMPK was downregulated with PA in a proximal epithelial cell model, whereas the AICAR treatment significantly upregulated phospho-AMPK. Values are means ±s.e.m. N = 5 in each group. Statistical analyses were performed by one-way analysis of variance (ANOVA) followed by Newman–Keuls, *P ≤ 0.05 versus BSA group and #P ≤ 0.05 versus PA group or by unpaired f-test + P ≤ 0.05 versus BSA group. AICAR, 5-aminoimidazole-4-carboxamide-1-β-d-ribofuranoside.
Figure 5
Figure 5. Effects of AMP-activated protein kinase (AMPK) activation on lipid oxidation and mitochondrial function from mice on standard diet (STD), high-fat diet (HFD), and HFD + AICAR
(a) Western blot analysis of the effect of HFD on phosphorylated acetyl-CoA carboxylase (ACQ in STD-, HFD-, and HFD +AlCAR-treated mice, (b) Relative densitometry of the immunoblot shows that phospho-ACC was reduced with HFD, whereas the AMPK activation prevented this inhibition. All figures were normalized with p-actin. Representative photomicrographs (original magnification ×400) illustrating phospho-ACC immunostaining in tubular epithelial cells in (c) STD, (d, e) HFD, and (f) HFD + AICAR. CD, collecting duct; G, glomerulus; PT, proximal tubule, (g) Quantitative analysis percent of phospho-ACC-positive staining area in mice on STD, HFD, or HFD + AICAR at 14 weeks. Values are means ± s.e.m. N = 6 in each group. Statistical analyses were performed by one-way analysis of variance (ANOVA) followed by Newman–Keuls, *P ≤0.05 versus mice on STD and #P ≤ 0.05 versus mice on HFD. (h–j) Cytochrome c oxidase (COX) activity, complex I activity, and citrate synthase measured in the kidney (respectively) in STD, HFD, and HFD + AICAR mice. Representative photomicrographs (original magnification ×400) illustrating COX staining in renal tissue of mice treated with (k) STD, (I) HFD, or (m) HFD + AIACAR. (n) Quantitative analysis of COX-positive staining. AICAR, 5-aminoimidazole-4-carboxamide-1-β-d-ribofuranoside.
Figure 6
Figure 6. Effects of AMP-activated protein kinase (AMPK) activation on renal lysosomal dysfunction
Electron microscopy evaluation of intracellular vacuoles in proximal tubules in mice treated with (a) a standard diet (STD), (b, c) a high-fat diet (HFD), or (d) HFD + AICAR. The photographs highlight an increase of intracellular vacuoles (arrow) with (b, c) HFD in addition of (c) enlarged multilaminar inclusion. BB, brush border; N, nucleus; M, mitochondria; mv, multilaminar vacuole. Representative photomicrograph (original magnification ×40) showing lysosomal-associated membrane protein 1 (LAMPI)–positive staining on intracellular vacuoles in mice fed a (e) STD, (f, g) a HFD (higher original magnification ×1000), and a (h) HFD + AICAR. (i) Quantitative analysis of LAMP1-positive staining, (j) Western blot analysis of LAMP1 in STD-, HFD-, and HFD +AlCAR-treated mice. Relative densitometry of the immunoblot shows that LAMP1 was significantly increased with HFD, whereas the AMPK activation prevented this rise, (k) All figures were normalized to β-actin. Values are means ±s.e.m. N = 6 in each group. Statistical analyses were performed by one-way analysis of variance (ANOVA) followed by Newman–Keuls, *P ≤ 0.05 versus mice on STD and #P ≤ 0.05 versus mice on HFD. AICAR, 5-aminoimidazole-4-carboxamide-1-β-d-ribofuranoside.
Figure 7
Figure 7. Lipid storage in tubular cells in mice fed a high-fat diet (HFD)
(a) Representative photomicrograph (original magnification ×40) showing that the vacuoles (arrow) are negative for Oil Red O Staining, (b) Representative photomicrograph illustrating cholesteryl esters with fluorescent dye Nile red staining in HFD (arrows), (c, d) Representative photomicrographs (original magnification ×1000) of semi-thin sections (original magnification ×1000) illustrating Toluidine Blue–positive dark blue vacuoles (arrow). Electron microscopy evaluation of ultrastructure of vacuoles in proximal tubules in mice treated with a HFD: presence of (e, f) enlarged clear vacuoles and (g, h) multilaminar inclusions (i: higher magnification), (j, k) Representative photomicrographs (original magnification ×1000) illustrating phospholipid accumulation in vacuolated tubule with Luxol Fast Blue in HFD (arrow, vacuoles stained in blue).
Figure 8
Figure 8. Effects of AMP-activated protein kinase (AMPK) activation in lipid accumulation in kidney and liver
Quantitative analysis of triglycerides, long-chain nonesterified fatty acid (NEFA), short-chain NEFA, cholesteryl esters, and phosphatidylcholine levels in liver (a, c, e, g, i, respectively) and in the kidney (b, d, f, h, j, respectively) in mice fed a standard diet (STD), a high-fat diet (HFD), or HFD + AICAR. Values are means ± s.e.m. N = 6 in each group. Statistical analyses were performed by one-way analysis of variance (ANOVA) followed by Newman-Keuls, *P ≤ 0.05 versus mice on STD and #P ≤ 0.05 versus mice on HFD. AICAR, 5-aminoimidazole-4-carboxamide-1-β-d-ribofuranoside.
Figure 9
Figure 9. Localization of 3-hydroxy-3-methylglutaryl-CoA reductase (HMGCoA) in renal tissue
Representative photomicrographs (original magnification ×400) illustrating 3-hydroxy-3-methylglutaryl-CoA reductase (HMGCoA) immunostaining in tubular epithelial cells in (a) standard diet (STD), (b) high-fat diet (HFD), and (c) HFD + AICAR. AICAR, 5-aminoimidazole-4-carboxamide-1-β-d-ribofuranoside; CD, collecting duct; PT, proximal tubule.
Figure 10
Figure 10. Representation of AMPK in kidney tissue in response to high-fat diet
ACC, acetyl CoA carboxylase; AICAR, 5-aminoimidazole-4-carboxamide-1-β-d-furanosyl 5'-monophosphate; AMPK, AMP-activated protein kinase; ECM, extracellular matrix; HMGCR, 3-hydroxy-3-methylglutaryl-CoA reductase; H2O2, hydrogen peroxide; MCP-1, monocyte chemoattractant protein-1; Nox4, NADPH oxidase 4; ROS, reactive oxygen species; TGF-β, transforming growth factor-β.

Similar articles

Cited by

References

    1. Collins AJ, Foley RN, Herzog C, et al. US Renal Data System 2010 Annual Data Report. American journal of kidney diseases: the official journal of the National Kidney Foundation. 2011;57(1 Suppl 1):A8, e1–e526. - PubMed
    1. Marcussen N. Atubular glomeruli and the structural basis for chronic renal failure. Lab Invest. 1992;66:265–284. - PubMed
    1. Taft JL, Nolan CJ, Yeung SP, et al. Clinical and histological correlations of decline in renal function in diabetic patients with proteinuria. Diabetes. 1994;43:1046–1051. - PubMed
    1. Gilbert RE, Cooper ME. The tubulointerstitium in progressive diabetic kidney disease: more than an aftermath of glomerular injury? Kidney Int. 1999;56:1627–1637. - PubMed
    1. Chagnac A, Weinstein T, Korzets A, et al. Glomerular hemodynamics in severe obesity. Am J Physiol Renal Physiol. 2000;278:F817–F822. - PubMed

Publication types

MeSH terms

LinkOut - more resources