. 2014 Feb;42(4):2433-47.
doi: 10.1093/nar/gkt1237. Epub 2013 Dec 4.

Vespucci: a system for building annotated databases of nascent transcripts

Affiliations

Vespucci: a system for building annotated databases of nascent transcripts

Karmel A Allison et al. Nucleic Acids Res. 2014 Feb.

Abstract

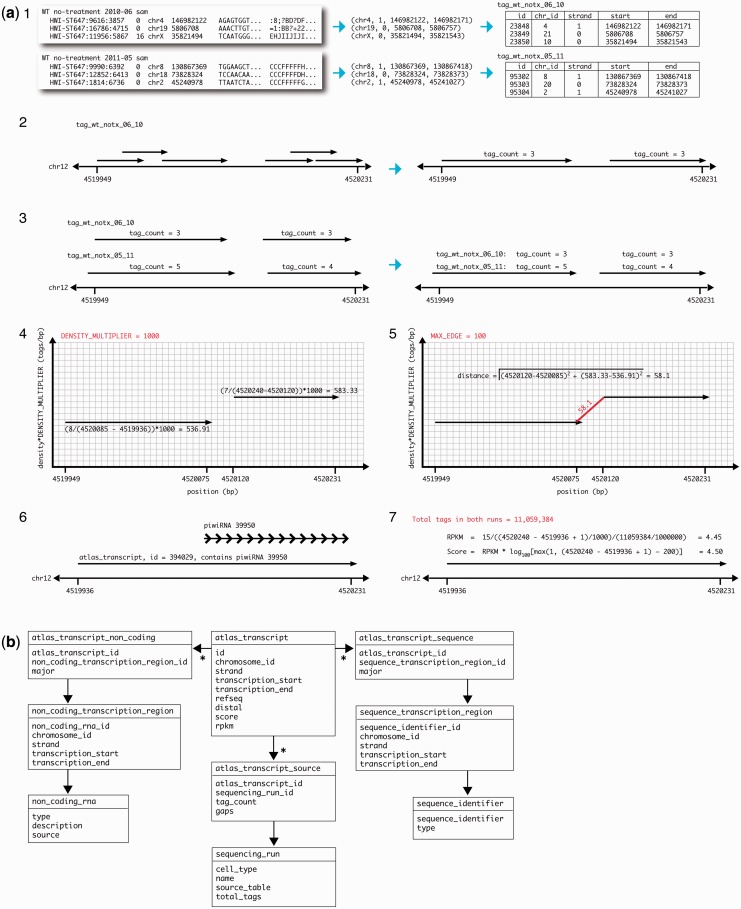
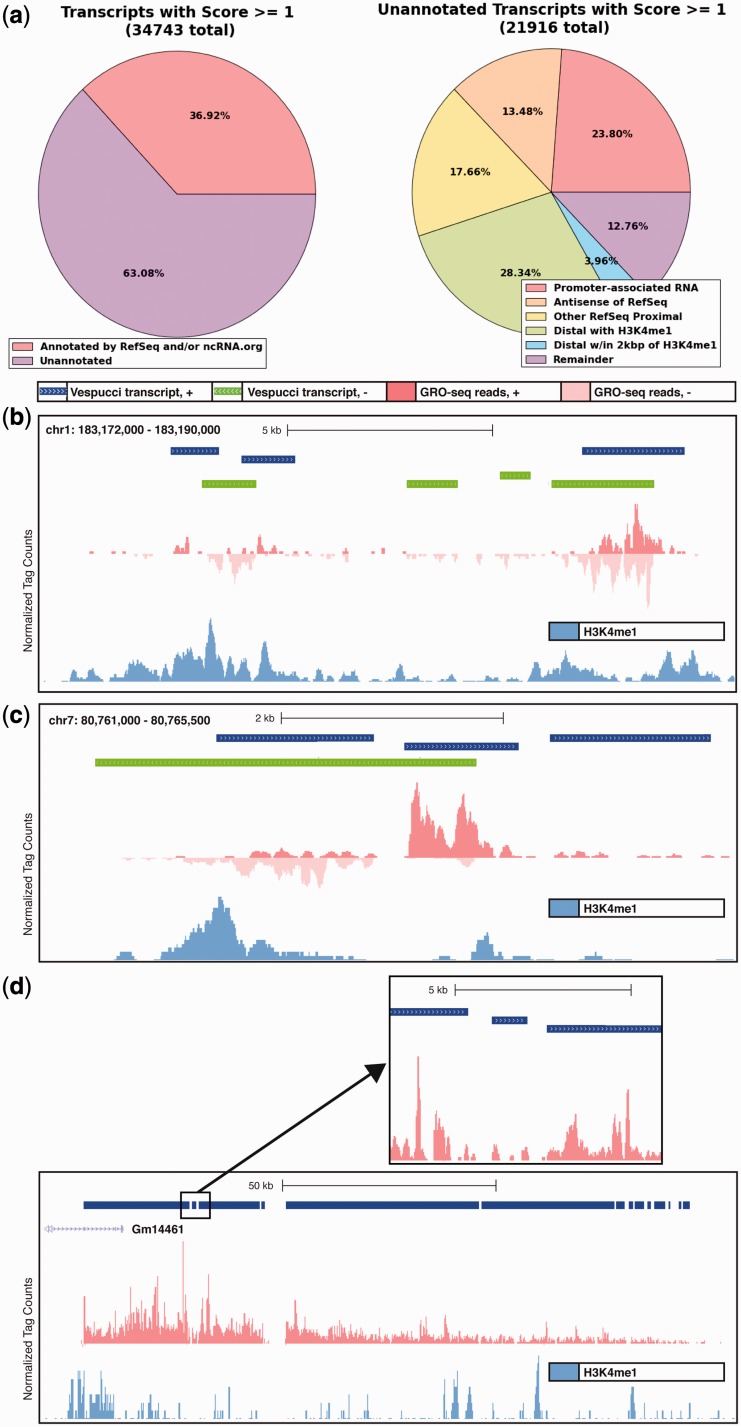
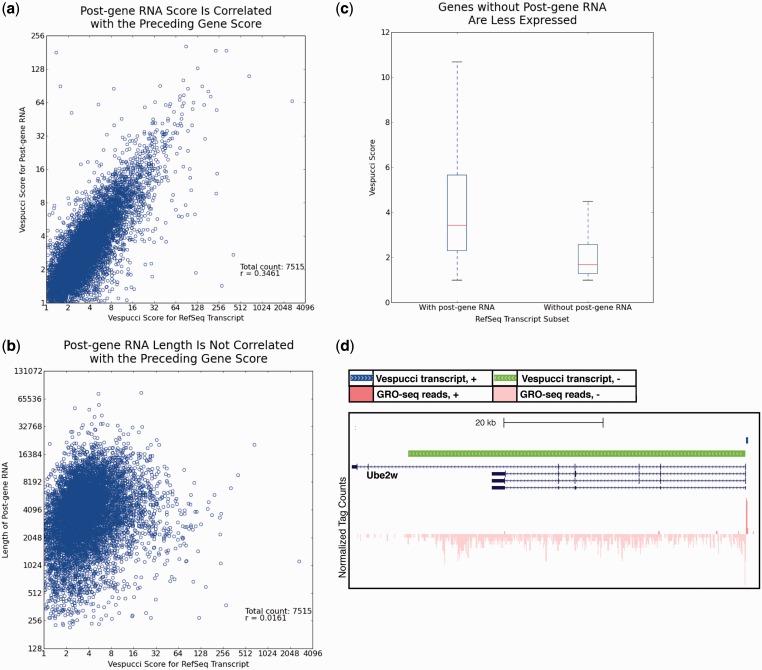
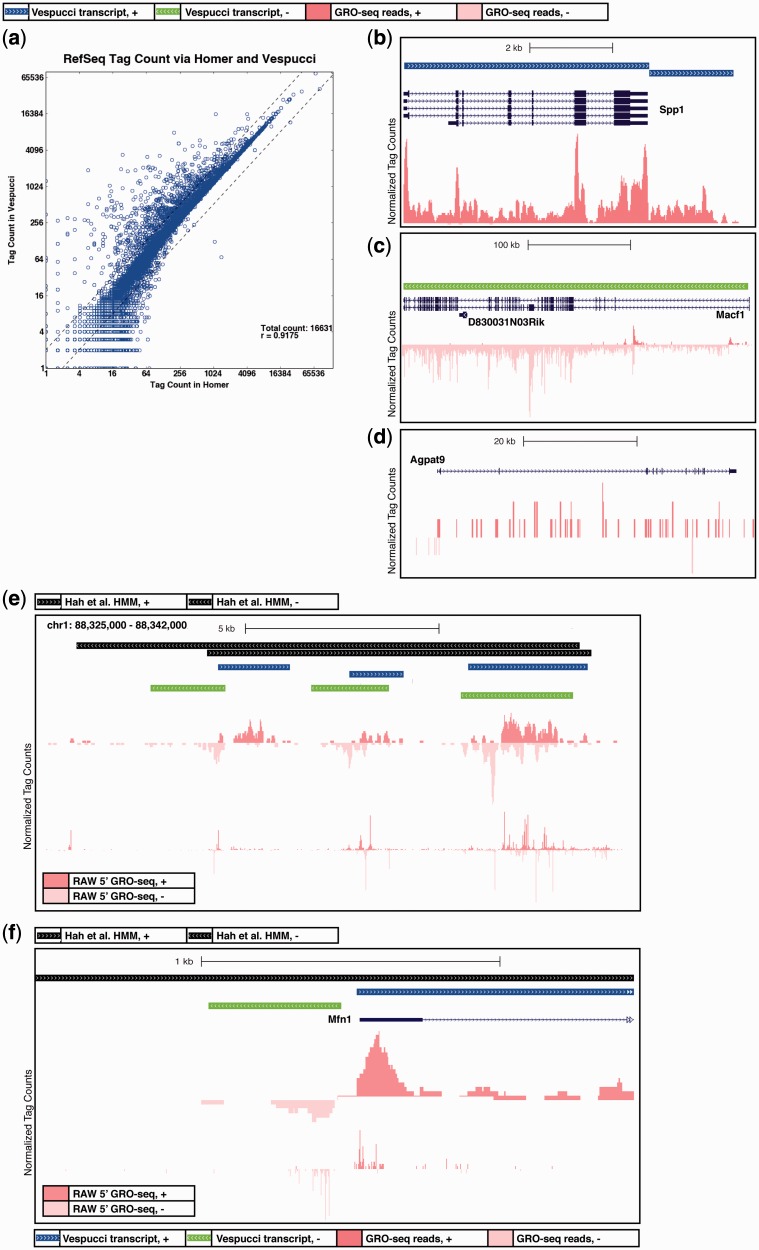
Global run-on sequencing (GRO-seq) is a recent addition to the series of high-throughput sequencing methods that enables new insights into transcriptional dynamics within a cell. However, GRO-sequencing presents new algorithmic challenges, as existing analysis platforms for ChIP-seq and RNA-seq do not address the unique problem of identifying transcriptional units de novo from short reads located all across the genome. Here, we present a novel algorithm for de novo transcript identification from GRO-sequencing data, along with a system that determines transcript regions, stores them in a relational database and associates them with known reference annotations. We use this method to analyze GRO-sequencing data from primary mouse macrophages and derive novel quantitative insights into the extent and characteristics of non-coding transcription in mammalian cells. In doing so, we demonstrate that Vespucci expands existing annotations for mRNAs and lincRNAs by defining the primary transcript beyond the polyadenylation site. In addition, Vespucci generates assemblies for un-annotated non-coding RNAs such as those transcribed from enhancer-like elements. Vespucci thereby provides a robust system for defining, storing and analyzing diverse classes of primary RNA transcripts that are of increasing biological interest.


Figures

Figure 1.
Figure 1.
GRO-sequencing reveals transcriptional dynamics in great detail, but can be difficult to interpret. (a) Short reads from GRO-sequencing experiments (red) can be mapped back to the reference genome (black) and assigned a genomic coordinate that includes chromosome, strand, starting basepair and ending basepair. (b) Promoter-associated RNA (paRNA) overlaps with the 5′ end of the Tmbim6 gene, antisense to the gene itself. The blue bar indicates the transcript that has been identified for Cstb itself, and the leftmost green bar shows the extent of the paRNA. (c) Enhancer RNA (eRNA) appears in GRO-sequencing samples (top track) as bi-directional transcripts centered on the binding sites of transcription factors (middle track) and marked by H3K4me1 (bottom track). (d) Transcription can continue past the 3′ ends of annotated RefSeq transcripts, making the exact boundary of relevant transcripts difficult to identify. At the Mmp12 locus, manual interpretation could lead to differing interpretations of where to mark transcript boundaries, either including or excluding the run-off at the 3′ end of the gene, and thus it is important to have a consistent algorithmically determined interpretation. Here, we show that Vespucci is able to either respect the RefSeq boundary (lower blue track) or to identify the entire nascent transcript (upper blue track). (e) Neighboring transcription regions can have different read densities. Two transcripts are identified along the sense strand, denoted by the blue bars at the top. These two transcripts are close in terms of basepair distance (363 bp apart), but they differ in terms of read-per-basepair densities, and therefore are kept as two separate transcripts.
Figure 2.
Figure 2.
Stepwise procedure for assembly of transcripts by Vespucci. (a) (1) Each sample, mapped to the reference genome, is reduced to its genomic coordinates and loaded into a separate database table. (2) Short reads from a single run are merged (separated by chromosome). (3) The merged proto-transcripts from each individual run are merged with proto-transcripts from other runs. The number of tags from each different run is stored. (4) The proto-transcripts from (3) are plotted in 2D space, with location in basepairs along the x-axis and the density in tags per basepair along the y-axis. The density is scaled according to a parameter, DENSITY_MULTIPLIER, that defines the relationship between the two units of measurement (basepairs and tags per basepair). (5) The proto-transcripts in 2D space are then merged according to a MAX_EDGE parameter that operates as the maximal allowed Euclidian distance from the rightmost edge of each transcript. The merged transcript here is considered a continuous unit of transcription by Vespucci. (6) These transcripts can then be associated with known RNA species from RefSeq and ncRNA databases based on genomic coordinates. (7) Transcripts are then scored according to a custom algorithm or RPKM. (b) Database schema showing the Vespucci transcript table structure, major columns and related entities. An asterisk indicates a ‘has many' relationship, and ID fields contain references to related tables.
Figure 3.
Figure 3.
Vespucci enables the identification and quantification of numerous RNA species in macrophages. (a) Using a score threshold of 1, the great majority (63%, left panel) of transcripts identified are not associated with known RefSeq genes or ncRNA. Of the unannotated set (right panel), more than one half are proximal to RefSeq genes, with the remainder being distal. (b) Transcripts are interspersed not only overlapping with the enhancer histone mark H3K4me1 but also between enhancers, indicating that complex regulatory regions undergo a great deal of active transcription spread over many kilobases. (c) Similarly, transcripts can extend a long distance beyond identifying histone marks at enhancers, with this itergenic region showing low levels of H3K4me1 and GRO-seq signal extending along a single strand for >5 kb beyond an identified H3K4me1 peak. (d) Vespucci identifies a long unannotated transcript downstream of Gm14461. Vespucci does not merge the entire region, but, with a gap parameter of 100 bp, separates it into several long regions with many shorter regions interspersed throughout. Closer inspection (inset) shows that the boundaries determined by Vespucci reflect real discontinuities in the GRO-seq signal that will require further study to interpret. H3K4me1 is shown on the lower track to indicate that this transcript is methylated at the 5′ end, much as a protein coding gene would be.
Figure 4.
Figure 4.
Transcription continues past the annotated 3′ ends of most genes. (a) The expression levels of transcripts immediately following the 3′ ends of RefSeq sequences are correlated with those of the preceding RefSeq transcripts as measured with Vespucci scores. (b) The length that transcription carries past the 3′ end has a weak but positive correlation with the expression level of the preceding RefSeq transcript as measured with Vespucci scores. (c) The 16% of RefSeq transcripts are not found to have post-gene RNA according to Vespucci. These RefSeq transcripts tend to have much lower expression levels as measured with Vespucci scores than the 84% of transcripts that do continue past their annotated 3′ ends. (d) In addition to having low expression levels, many of the RefSeq transcripts without post-gene RNA are notable in that the transcript called by Vespucci does not reach the annotated 3′ end of the gene, as is the case with the Ube2w gene here.
Figure 5.
Figure 5.
Vespucci retrieves RefSeq expression levels without losing non-coding RNAs. (a) RefSeq identifiers can be used to compare the tag counts determined by Vespucci at RefSeq genes with the tag counts determined by the HOMER software, which uses a gene-centric approach to sum GRO-seq tags over known genes. The correlation between tag counts is generally good, with deviations from the diagonal attributable to three primary categories of transcripts: (b) Vespucci does not segment transcripts at alternative isoforms, but returns the tags for the whole transcript for each contained isoform. In contrast, HOMER tallies tags within the precise boundaries of each isoform, resulting in discrepancies between the two methods at shorter isoforms, such as the Spp1 gene seen here; (c) as with multiple isoforms, overlapping genes are not segmented by Vespucci, and the tag count for the entire transcript covering Macf1 is associated with the short gene that is overlapping, D830031N03Rik; and (d) genes that have few dispersed tags that cannot be adequately merged yield several smaller transcripts according to Vespucci, whereas HOMER implicitly joins them and counts all that fall along the body of the gene regardless of continuity of transcription. (e) The HMM described by Hah et al. identifies transcripts using a two-state model that calls regions transcribed (black bars) or untranscribed. The HMM identifies many fewer transcripts than Vespucci, in part, because it merges together transcripts called as distinct by Vespucci. Here, three pairs of bi-directional RNAs that are identified as two single units by the HMM. The bottom track shows data from previously published 5′-GRO-seq, a method that detects nascent RNA with a 5′ 7-methylguanylated cap. This method identifies start sites of nascent RNAs genome-wide. The data here, from RAW macrophages, show that Vespucci captures more accurately the separately initiated transcripts. (f) Similarly, some transcripts are called by Vespucci at expression levels too low for the HMM. Here, a paRNA is identified by Vespucci but not the HMM. The bottom track again shows 5′-GRO-seq from RAW macrophages, where the paRNA start site can be clearly seen.

Similar articles

Cited by

References

    1. Core LJ, Waterfall JJ, Lis JT. Nascent RNA sequencing reveals widespread pausing and divergent initiation at human promoters. Science. 2008;322:1845–1848. - PMC - PubMed
    1. Hah N, Danko CG, Core L, Waterfall JJ, Siepel A, Lis JT, Kraus WL. A rapid, extensive, and transient transcriptional response to estrogen signaling in breast cancer cells. Cell. 2011;145:622–634. - PMC - PubMed
    1. Wang D, Garcia-Bassets I, Benner C, Li W, Su X, Zhou Y, Qiu J, Liu W, Kaikkonen MU, Ohgi KA, et al. Reprogramming transcription by distinct classes of enhancers functionally defined by eRNA. Nature. 2011;474:390–394. - PMC - PubMed
    1. Kaikkonen MU, Spann NJ, Heinz S, Romanoski CE, Allison KA, Stender JD, Chun HB, Tough DF, Prinjha RK, Benner C, et al. Remodeling of the enhancer landscape during macrophage activation is coupled to enhancer transcription. Mol. Cell. 2013;51:310–325. - PMC - PubMed
    1. Kaikkonen MU, Lam MTY, Glass CK. Non-coding RNAs as regulators of gene expression and epigenetics. Cardiovasc. Res. 2011;90:430–440. - PMC - PubMed

Publication types