. 2013 Dec 4:11:298.
doi: 10.1186/1479-5876-11-298.

Leukemia cells induce changes in human bone marrow stromal cells

Affiliations

Leukemia cells induce changes in human bone marrow stromal cells

Sara Civini et al. J Transl Med. .

Abstract

Background: Bone marrow stromal cells (BMSCs) are multipotent cells that support angiogenesis, wound healing, and immunomodulation. In the hematopoietic niche, they nurture hematopoietic cells, leukemia, tumors and metastasis. BMSCs secrete of a wide range of cytokines, growth factors and matrix proteins which contribute to the pro-tumorigenic marrow microenvironment. The inflammatory cytokines IFN-γ and TNF-α change the BMSC secretome and we hypothesized that factors produced by tumors or leukemia would also affect the BMSC secretome and investigated the interaction of leukemia cells with BMSCs.

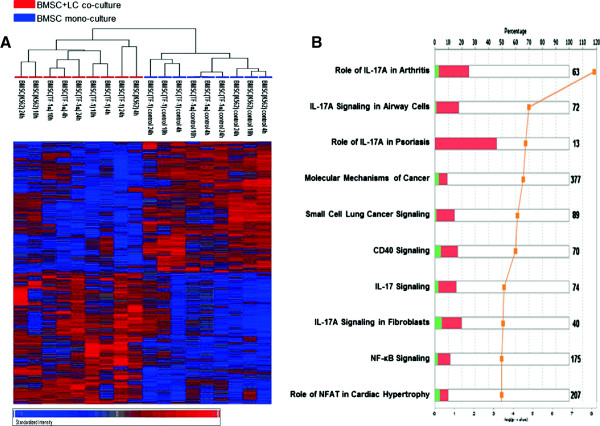
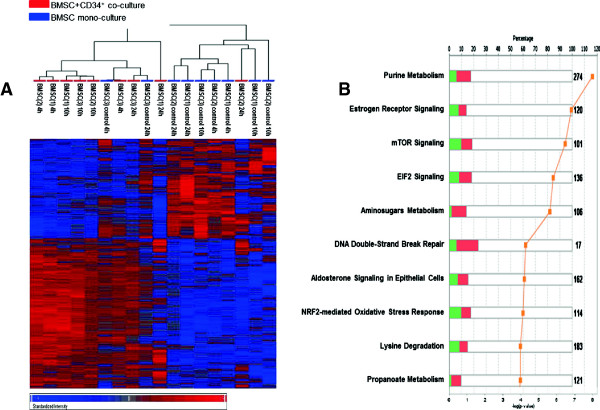
Methods: BMSCs from healthy subjects were co-cultured with three myeloid leukemia cell lines (TF-1, TF-1α and K562) using a trans-well system. Following co-culture, the BMSCs and leukemia cells were analyzed by global gene expression analysis and culture supernatants were analyzed for protein expression. As a control, CD34+ cells were also cocultured with BMSCs.

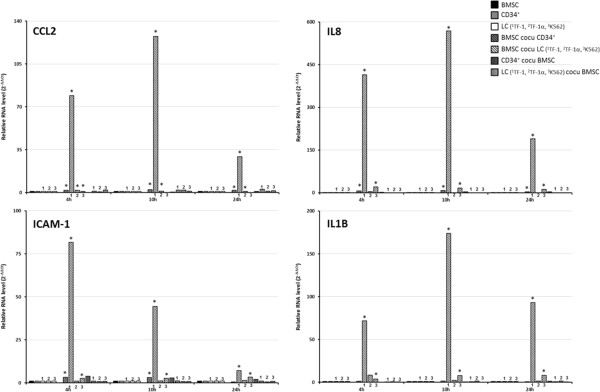
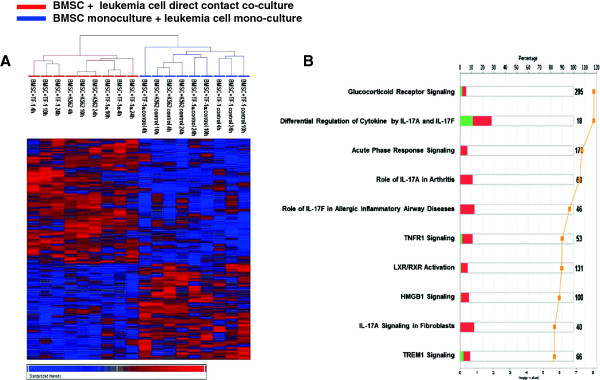
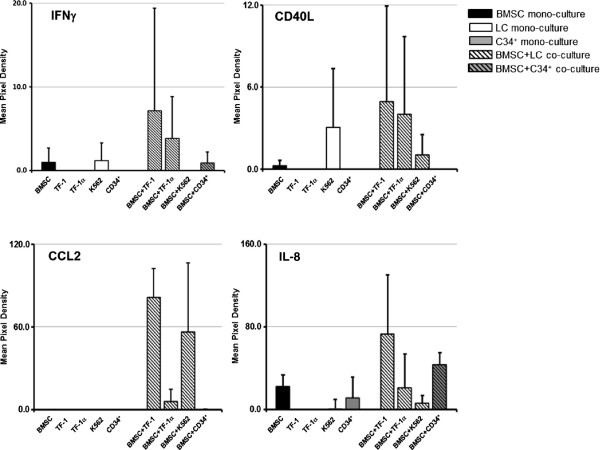
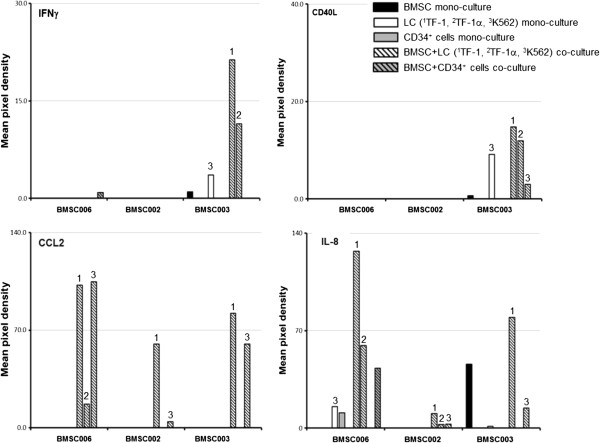
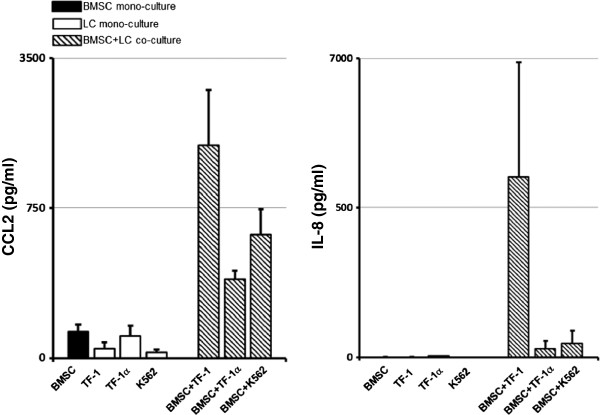
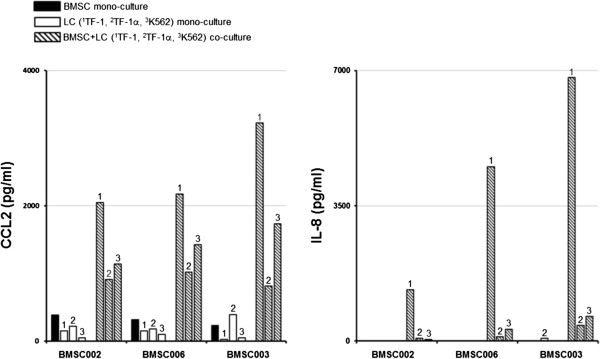
Results: Co-culture induced leukemia cell gene expression changes in stem cell pluripotency, TGF-β signaling and carcinoma signaling pathways. BMSCs co-cultured with leukemia cells up-regulated a number of proinflammatory genes including IL-17 signaling-related genes and IL-8 and CCL2 levels were increased in co-culture supernatants. In contrast, purine metabolism, mTOR signaling and EIF2 signaling pathways genes were up-regulated in BMSCs co-cultured with CD34+ cells.

Conclusions: BMSCs react to the presence of leukemia cells undergoing changes in the cytokine and chemokine secretion profiles. Thus, BMSCs and leukemia cells both contribute to the creation of a competitive niche more favorable for leukemia stem cells.


Figures

Figure 1
Figure 1
Gene expression analysis of BMSCs co-cultured with leukemia cells compared with BMSC mono-cultures shows changes in IL-17 signaling-related genes. (A) Hierarchical clustering analysis of 1540 differentially expressed genes in BMSCs co-cultured in transwells with three leukemia cell lines (TF-1, TF-1α and K562) compared with BMSC mono-cultures (control) using Partek Genomic Suite program (ANOVA test with unadjusted p-value < 0.05). The displayed colors represent the fold changes where shades of red and blue indicate up- and down-regulation respectively. The color key for the sample labels is on the top left. (B) Ingenuity Pathway Analysis (IPA) of the 1540 differentially expressed BMSC genes. Numerical symbols at the right side of each bar indicate the total number of genes composing the pathway. The bars indicate the percentage of up- (red bar) and down-regulated (green bar) genes in each pathway, while the orange line indicates minus-log transformed p-value. The top 10 canonical pathways are shown.
Figure 2
Figure 2
The expression of IL-17 signaling-related genes increase in BMSCs co-cultured with leukemia cells. Quantitative RT-PCR was performed to quantify the expression levels of CCL2, ICAM1, IL8 and IL1B in BMSCs (black column), CD34+ cells (grey bars) and TF-1 (1), TF-1a(2) and K562(3) leukemia cell (LC) (white bars) mono-cultures, BMSCs co-cultured in transwells with leukemia cell lines (black and white stripped column) and BMSCs co-cultured in transwells with CD34+ cells (grey and black stripped column). The RNA levels were shown as 2-ΔΔCt method. Sample key legend is at the top right. * p-value < 0.05
Figure 3
Figure 3
Gene expression analysis of BMSCs co-cultured in direct contact with leukemia cells shows changes in IL-17 signaling-related genes. BMSCs from three healthy donors were co-cultured in direct contact with the three different leukemia cell lines (TF-1, TF-1α and K562). The cells were harvested at 4 h, 10 h and 24 h and total RNA were extracted. The total RNA from BMSC mono-cultures was mixed with the total RNA from TF-1, TF-1α or K562 cell mono-cultures and the resulting three mixed total RNA samples were used as a “mono-culture” control and were subjected to gene expression analysis. The RNA from BMSCs and leukemia cells co-cultured in direct contact was extracted and gene expression was analyzed. Analysis with Partek Genomic Suite revealed that 544 genes that were differently expressed between the BMSCs and leukemia cell direct contact co-culture samples and the mono-culture controls (p-value < 0.05, FDR < 0.01). Panel A; Hierarchical clustering analysis of 544 differentially expressed genes in BMSCs and leukemia cell direct contact co-cultre samples compared with the mono-cultures (control) using Partek Genomic Suite program (ANOVA test with unadjusted p-value < 0.05). The displayed colors represent the fold changes where shades of red and blue indicate up- and down-regulation respectively. The color key for the sample labels is on the top left. Panel B. Ingenuity Pathway Analysis (IPA) of the 544 differentially expressed genes. Numerical symbols at the right side of each bar indicate the total number of genes composing the pathway. The bars indicate the percentage of up- (red bar) and down-regulated (green bar) genes in each pathway, while the orange line indicates minus-log transformed p-value. The top 10 canonical pathways are shown.
Figure 4
Figure 4
Gene expression analysis of BMSCs co-cultured with CD34+ cells compared with BMSC mono-cultures shows changes in metabolism related genes. (A) Hierarchical cluster analysis of 4904 differentially expressed genes in BMSCs co-cultured in transwells with CD34+ cells from three healthy donors compared with BMSC mono-cultures (control) using Partek Genomic Suite program (ANOVA test with unadjusted p-value < 0.05). The displayed colors represent the fold changes with the shades of red and blue indicating up- and down-regulation respectively. The color key for the sample labels is on the top left. (B) Ingenuity Pathway Analysis (IPA) of the 4904 differentially expressed BMSC genes. Numerical symbols at the right side of each bar indicate the total number of genes in each pathway. The bars indicate the percentage of up- (red bar) and down-regulated (green bar) genes in each pathway, while the orange line indicates minus-log transformed p-value. The top 10 canonical pathways are shown.
Figure 5
Figure 5
IL-17 signaling-related cytokine levels are greater in supernatants from BMSCs co-cultured with leukemia cells. Supernatants from the cultures were harvested after 48 hours and tested for soluble factors using an immunoblotting assay. The supernatants were from BMSC mono-cultures (black bars), TF1, TF-1α and K562 leukemia cell mono-cultures (white bars), CD34+ cells mono-cultures (grey bars), BMSCs co-cultured in transwells with leukemia cells (black and white stripped bars) and BMSCs co-cultured with CD34+ cells (black and grey stripped bars). The relative expression of selected cytokines was measured using array protein panel A (R&D System). The relative concentrations of IFN-γ, CD40L, CCL2 and IL-8 were calculated as a mean pixel density after normalization with positive control and background subtraction. The sample labeling legend is at the top right. The histograms represent results of 3 experiments with BMSCs from three different healthy donors.
Figure 6
Figure 6
IL-17 signaling-related cytokine levels increase in supernatants from BMSCs co-cultured with leukemia cells: comparison of the effects of BMSCs from 3 different donors. BMSC mono-culture (black bars), TF1 (1), TF-1a (2) and K562 (3) leukemia cell (LC) mono-culture (white bars) and CD34+ cell mono-culture (grey bars), BMSC/leukemia cell transwell co-culture (black and white stripped bars) and BMSC/CD34+ cell transwell co-culture (black and grey stripped bars) supernatants were harvested after 48 h. The relative expression of selected cytokines was measured using array protein panel A (R&D System) immunobloting assay. The relative amounts of IFN-γ, CD40L, CCL2 and IL-8 were calculated as a mean pixel density after normalization with positive control and background subtraction. The sample labeling legend is at the top right. The results of 3 experiments with BMSCs from three healthy donors (BMSC006, BMSC002 and BMSC003) are shown.
Figure 7
Figure 7
CCL2 and IL-8 supernatant levels are greater in BMSCs co-cultured with leukemia cells. BMSC mono-culture (black bars), TF1, TF-1α and K562 leukemia cell mono-culture (white bars) and BMSC/leukemia cell transwell co-cultures (black and white stripped bars) supernatants were harvested after 48 h. The concentration (pg/ml) of CCL2 and IL-8 was measured using an ELISA assay. The sample labeling legend is at the top left. The figures represent the results of 3 experiments with BMSCs obtained from three different healthy donors.
Figure 8
Figure 8
CCL2 and IL-8 levels increase in supernatants from BMSCs co-cultured with leukemia cells: comparison of the effects of BMSCs from 3 different donors. BMSC mono-culture (black bars), TF-1 (1), TF-1a (2) and K562 (3) leukemia cell mono-culture (white bars) and BMSC/leukemia cell transwell co-culture (black and white stripped bars) supernatants were harvested after 48 h. The amount (pg/ml) of CCL2 and IL-8 was measured by an ELISA assay. The sample labeling legend is at the top left. The results of 3 experiments with BMSCs from three healthy donors (BMSC006, BMSC002 and BMSC003) are shown.

References

    1. Wang Y, Krivtsov AV, Sinha AU, North TE, Goessling W, Feng Z. et al. The Wnt/beta-catenin pathway is required for the development of leukemia stem cells in AML. Science. 2010;11(5973):1650–1653. doi: 10.1126/science.1186624. - DOI - PMC - PubMed
    1. Hoang VT, Zepeda-Moreno A, Ho AD. Identification of leukemia stem cells in acute myeloid leukemia and their clinical relevance. Biotechnol J. 2012;11(6):779–788. doi: 10.1002/biot.201100350. - DOI - PubMed
    1. Ashton JM, Balys M, Neering SJ, Hassane DC, Cowley G, Root DE. et al. Gene sets identified with oncogene cooperativity analysis regulate in vivo growth and survival of leukemia stem cells. Cell Stem Cell. 2012;11(3):359–372. doi: 10.1016/j.stem.2012.05.024. - DOI - PMC - PubMed
    1. Ferretti E, Cocco C, Airoldi I, Pistoia V. Targeting acute myeloid leukemia cells with cytokines. J Leukoc Biol. 2012;11(3):567–575. doi: 10.1189/jlb.0112036. - DOI - PubMed
    1. Jordan CT, Upchurch D, Szilvassy SJ, Guzman ML, Howard DS, Pettigrew AL. et al. The interleukin-3 receptor alpha chain is a unique marker for human acute myelogenous leukemia stem cells. Leukemia: official journal of the Leukemia Society of America. Leukemia. 2000;11(10):1777–1784. doi: 10.1038/sj.leu.2401903. - DOI - PubMed

Publication types