. 2013 Dec 5:3:3432.
doi: 10.1038/srep03432.

Quantitative metabolic imaging using endogenous fluorescence to detect stem cell differentiation

Affiliations

Quantitative metabolic imaging using endogenous fluorescence to detect stem cell differentiation

Kyle P Quinn et al. Sci Rep. .

Abstract

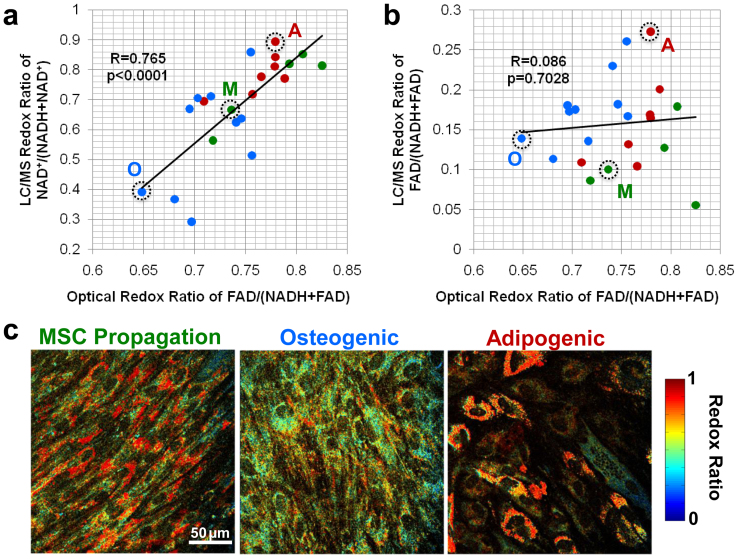
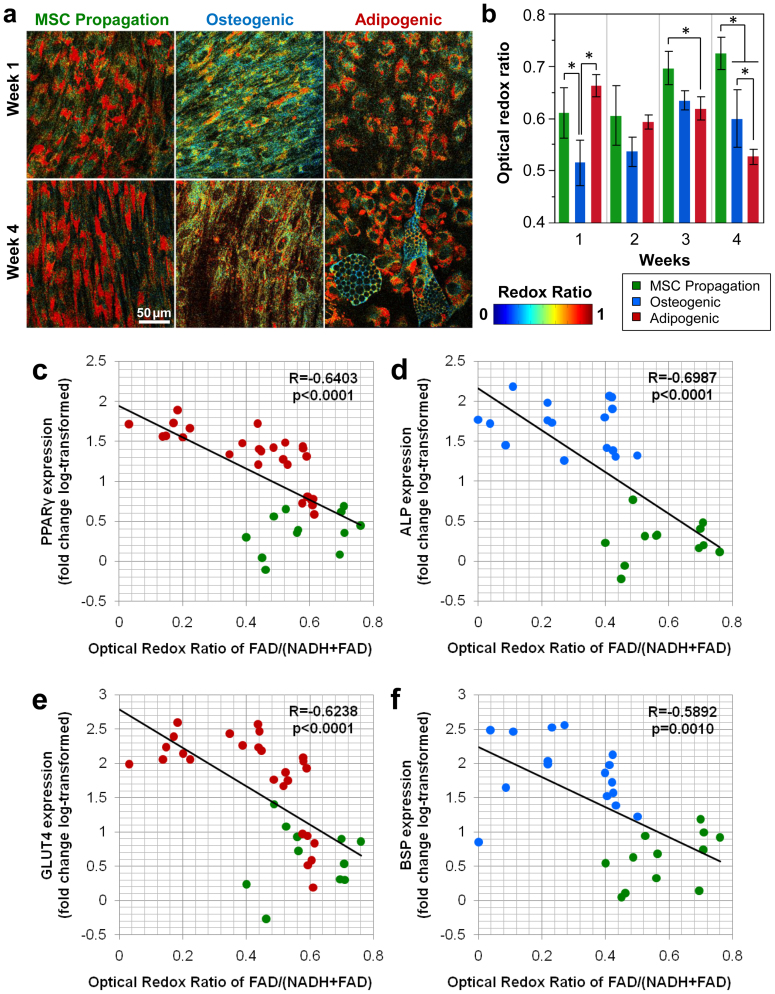
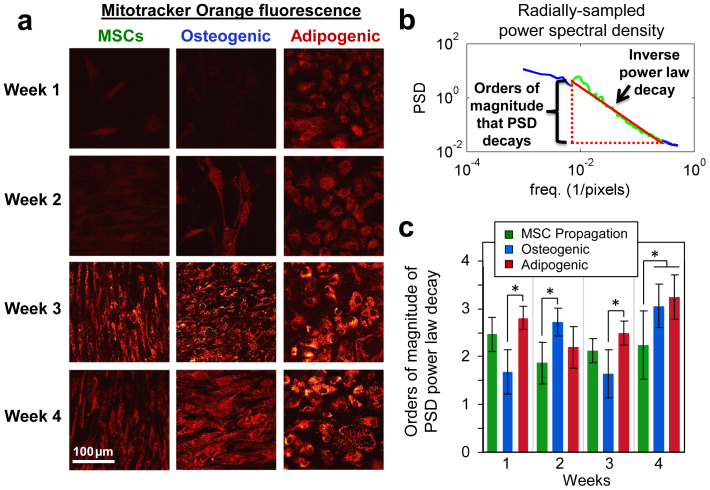
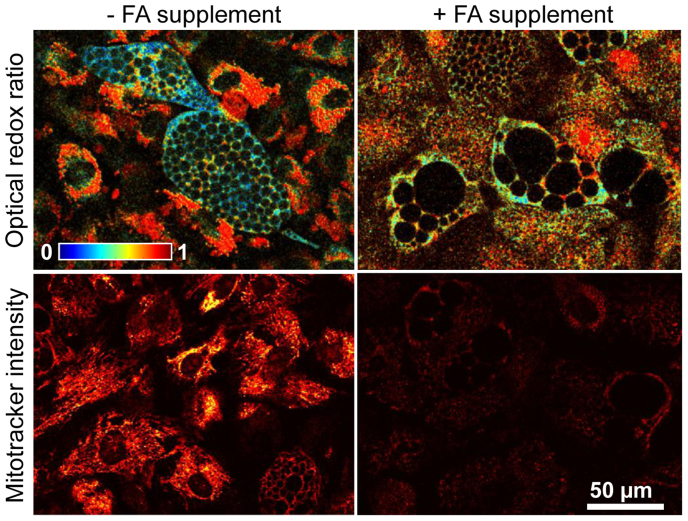
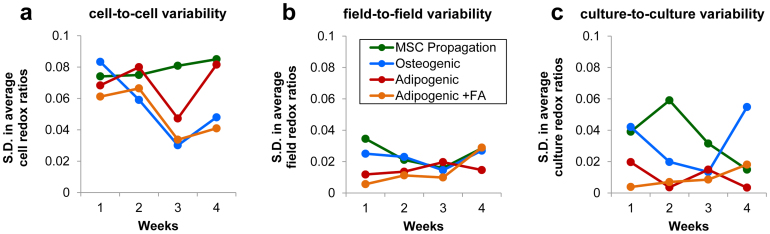
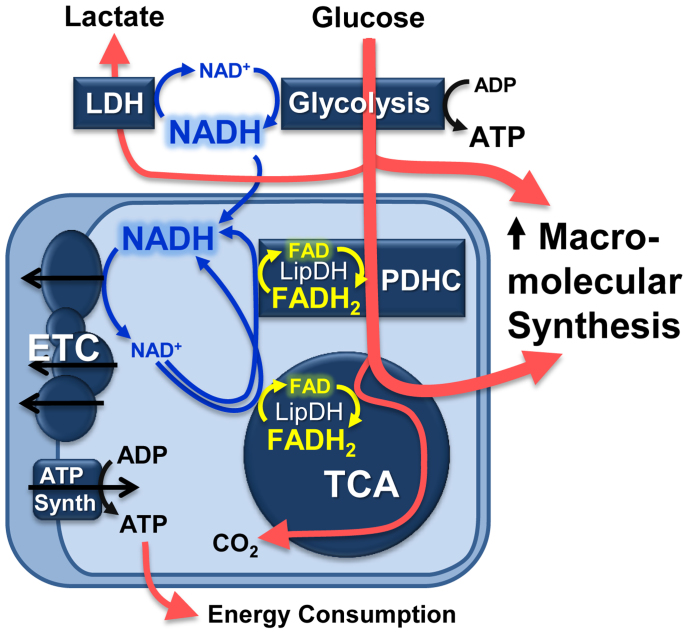
The non-invasive high-resolution spatial mapping of cell metabolism within tissues could provide substantial advancements in assessing the efficacy of stem cell therapy and understanding tissue development. Here, using two-photon excited fluorescence microscopy, we elucidate the relationships among endogenous cell fluorescence, cell redox state, and the differentiation of human mesenchymal stem cells into adipogenic and osteoblastic lineages. Using liquid chromatography/mass spectrometry and quantitative PCR, we evaluate the sensitivity of an optical redox ratio of FAD/(NADH + FAD) to metabolic changes associated with stem cell differentiation. Furthermore, we probe the underlying physiological mechanisms, which relate a decrease in the redox ratio to the onset of differentiation. Because traditional assessments of stem cells and engineered tissues are destructive, time consuming, and logistically intensive, the development and validation of a non-invasive, label-free approach to defining the spatiotemporal patterns of cell differentiation can offer a powerful tool for rapid, high-content characterization of cell and tissue cultures.


Figures

Figure 1
Figure 1. Comparison of optical redox ratio with intracellular cofactor concentration ratio measured through LC/MS-MS.
(a) The optical redox ratio is significantly correlated (R = 0.765, p < 0.0001) with the LC/MS-MS ratio of NAD+/(NADH + NAD+). (b) However, the optical redox ratio is not associated (R = 0.086, p = 0.7028) with the LC/MS-MS ratio of FAD/(NADH + FAD). Green points represent individual MSC propagation cultures, blue points represent osteogenic cultures, and red points represent adipogenic cultures. (c) Representative images from the cultures circled in (a) and (b) demonstrate overall differences in the average redox ratio among cultures, but also inter- and intra-cellular variability in the optical redox ratio, which is not measurable with LC/MS-MS.
Figure 2
Figure 2. Decrease in optical redox ratio coincides with differentiation.
(a) Representative redox ratio maps and (b) field-averaged redox ratios demonstrate a decrease in redox ratio upon differentiation. Cultures in MSC propagation media demonstrate a slight increase in redox ratio over time, while osteogenic differentiation produces an immediate decrease in redox ratio at week 1 (p = 0.0016). By week 4 both osteogenic and adipogenic cultures exhibit lower redox ratios compared to MSC propagation cultures (p ≤ 0.0001). Error bars in (b) represent standard deviation. (c) PPAR-γ expression was significantly correlated (R = −0.6403, p < 0.0001) with the average optical redox ratio of adipogenic and MSC propagation cultures. (d) ALP expression in osteogenic and MSC propagation cultures was also significantly correlated (R = −0.6987; p < 0.0001) with average redox ratio. (e) GLUT4 expression (R = −0.6238, p < 0.0001) and (f) BSP expression (R = −0.5892, p = 0.0010) exhibited significant correlations with redox ratio as well.
Figure 3
Figure 3. Mitochondrial organization changes upon stem cell differentiation.
(a) Mitotracker Orange fluorescence staining demonstrated an increase in intensity over time in all groups, and increased organization throughout differentiated cells. (b) The range of fractal clustering of the mitochondria was measured by identifying the spatial frequencies over which the power spectral density (PSD) decays according to an inverse power law and quantifying the orders of magnitude over which the PSD decays as a power law. (c) Osteogenic cultures on weeks 2 and 4, as well as Adipogenic cultures on week 4, exhibited a significantly higher range of fractal clustering compared to MSC propagation cultures (p ≤ 0.0497). Error bars represent standard deviation.
Figure 4
Figure 4. Exogenous fatty acids (FA) during adipogenic differentiation attenuated changes in mitochondrial function and structure.
Treatment with an oleic acid supplement attenuated the decrease in redox ratio normally observed in differentiating cells, despite an increase in lipid droplet size. Lipid droplets could easily be identified by the lack of autofluorescence in these spherical-shaped organelles. Additionally, mitotracker orange staining intensity was attenuated and the range of fractal clustering was reduced in the adipogenic group with a FA supplement.
Figure 5
Figure 5. Variability in redox ratio measurements.
(a) The standard deviation (S.D.) of the cell redox ratio values within individual image fields is summarized for each group and time point. (b) The S.D. of field-averaged redox ratios within each individual culture demonstrates field-to-field variability is substantially lower than cell-to-cell variability within fields. (c) The S.D. in the average culture redox ratios within each group and time point are plotted, and demonstrate culture-to culture variability is similar to field-to-field variability.
Figure 6
Figure 6. Schematic relating the increase in macromolecular biosynthesis during stem cell differentiation to changes in NADH and FAD concentrations.
When glucose catabolism outpaces ATP production due to the biosynthesis of macromolecules (e.g. fatty acids), NADH concentrations will increase and the concentration of FAD bound to enzyme complexes containing lipoamide dehydrogenase (LipDH) will decrease. These changes in NADH and FAD concentrations can be detected through the optical redox ratio as demonstrated in Figure 1, and result in a decrease in the optical redox ratio during the induction of differentiation in stem cell cultures. Abbreviations: LDH = lactate dehydrogenase, PDHC = pyruvate dehydrogenase complex, ETC = electron transport chain, TCA = tricarboxylic acid cycle.

References

    1. Berthiaume F., Maguire T. J. & Yarmush M. L. Tissue engineering and regenerative medicine: history, progress, and challenges. Annu Rev Chem Biomol Eng 2, 403 (2011). - PubMed
    1. Guilak F. et al. Control of stem cell fate by physical interactions with the extracellular matrix. Cell Stem Cell 5 (1), 17 (2009). - PMC - PubMed
    1. Kim H. J., Kim U. J., Vunjak-Novakovic G., Min B. H. & Kaplan D. L. Influence of macroporous protein scaffolds on bone tissue engineering from bone marrow stem cells. Biomaterials 26 (21), 4442 (2005). - PubMed
    1. Quinn K. P. et al. Characterization of metabolic changes associated with the functional development of 3D engineered tissues by non-invasive, dynamic measurement of individual cell redox ratios. Biomaterials 33 (21), 5341 (2012). - PMC - PubMed
    1. Stastna M., Chimenti I., Marban E. & Van Eyk J. E. Identification and functionality of proteomes secreted by rat cardiac stem cells and neonatal cardiomyocytes. Proteomics 10 (2), 245 (2010). - PMC - PubMed

Publication types