. 2014 Jan;16(2):191-203.
doi: 10.1093/neuonc/not167. Epub 2013 Dec 4.

A novel tumor-promoting role for nuclear factor IA in glioblastomas is mediated through negative regulation of p53, p21, and PAI1

Affiliations

A novel tumor-promoting role for nuclear factor IA in glioblastomas is mediated through negative regulation of p53, p21, and PAI1

Jun Sung Lee et al. Neuro Oncol. 2014 Jan.

Abstract

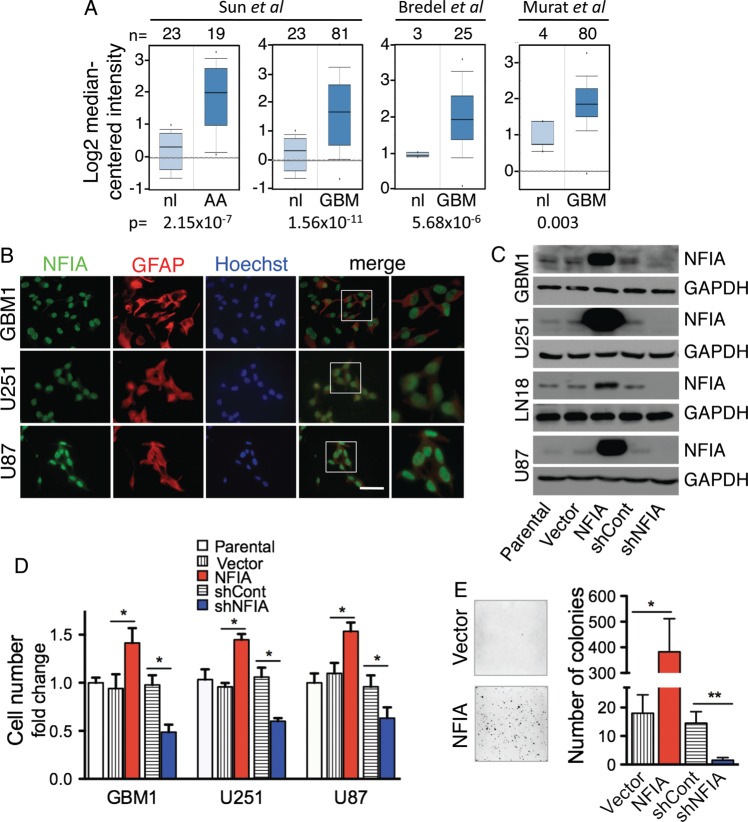
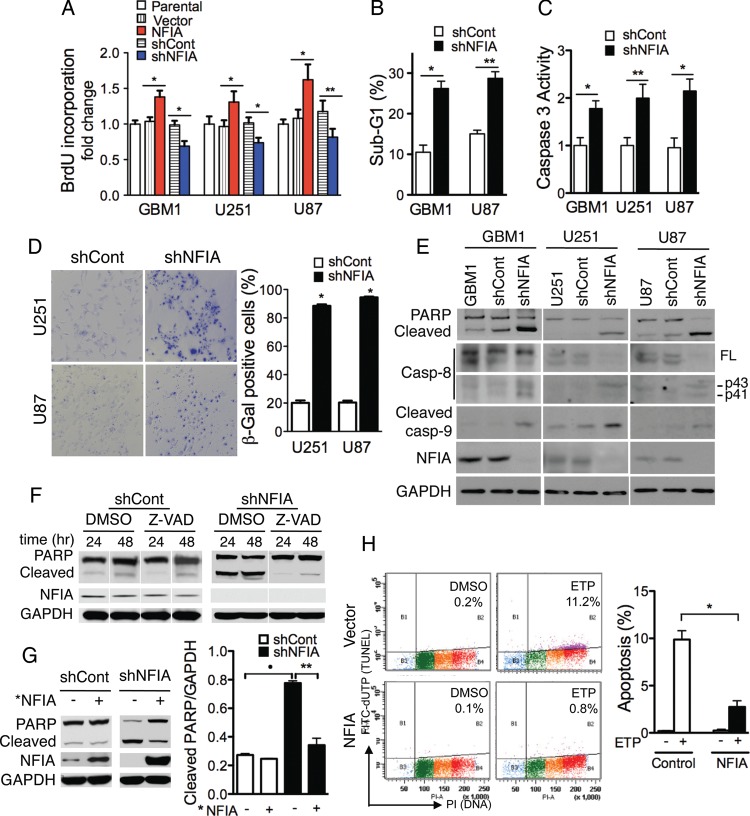
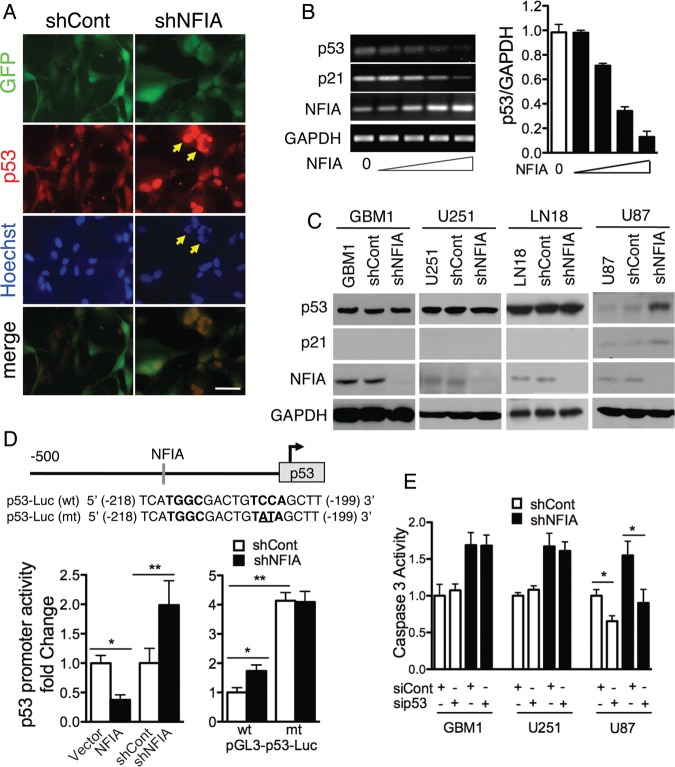
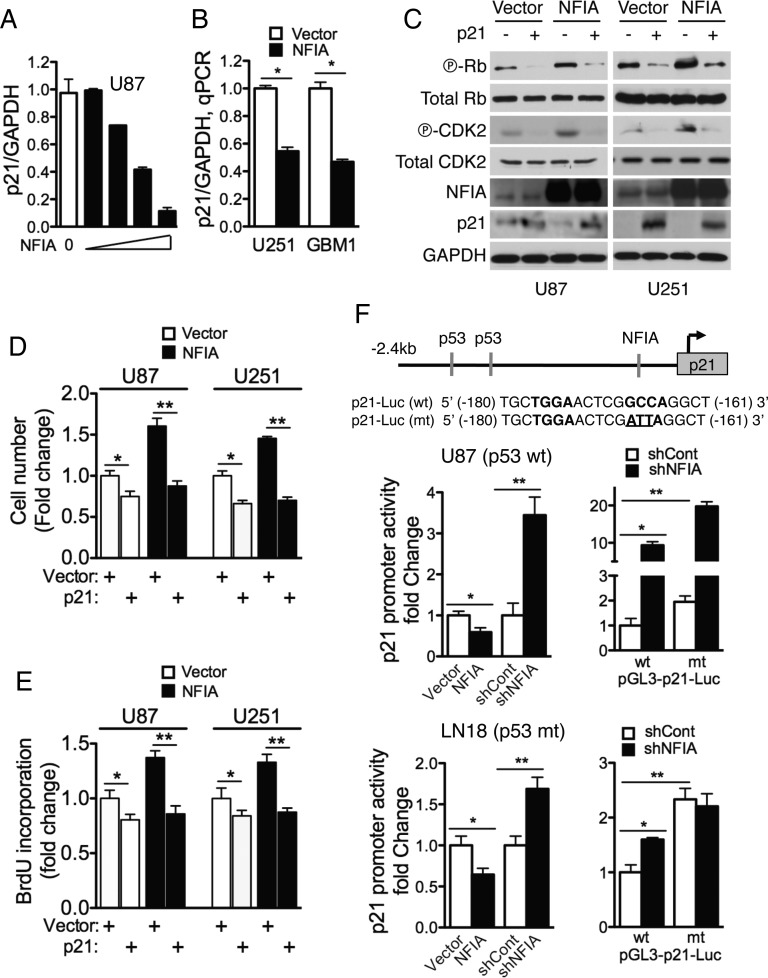
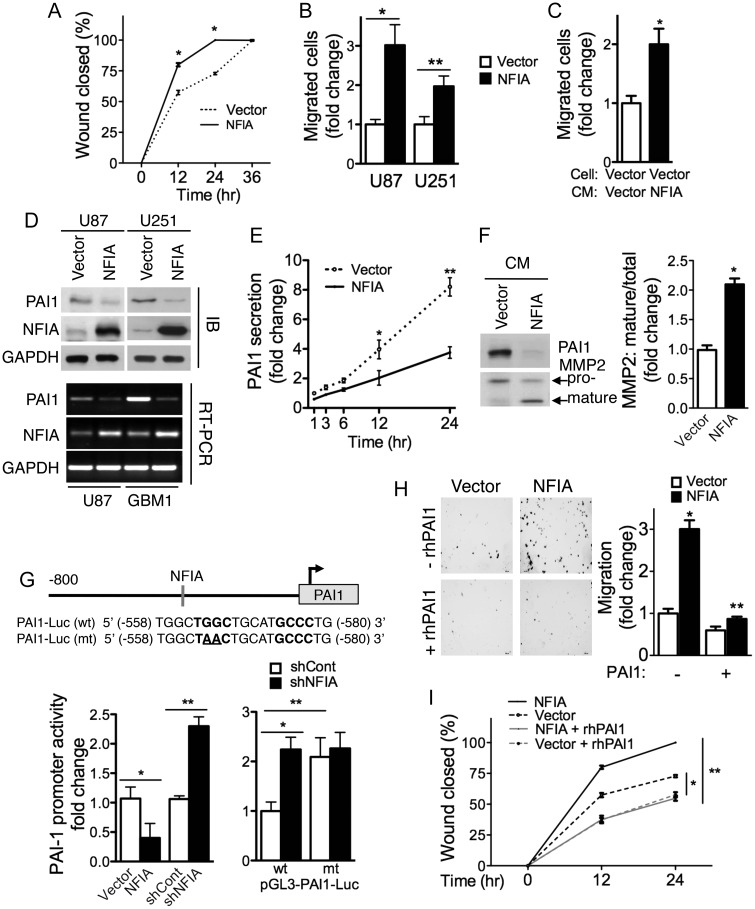
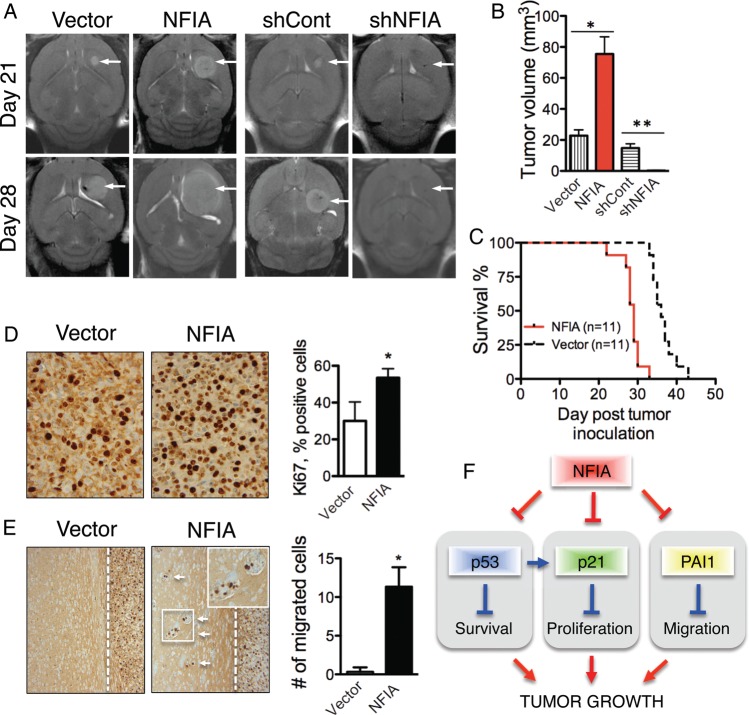
Background Nuclear factor IA (NFIA), a transcription factor and essential regulator in embryonic glial development, is highly expressed in human glioblastoma (GBM) compared with normal brain, but its contribution to GBM and cancer pathogenesis is unknown. Here we demonstrate a novel role for NFIA in promoting growth and migration of GBM and establish the molecular mechanisms mediating these functions. Methods To determine the role of NFIA in glioma, we examined the effects of NFIA in growth, proliferation, apoptosis, and migration. We used gain-of-function (overexpression) and loss-of-function (shRNA knockdown) of NFIA in primary patient-derived GBM cells and established glioma cell lines in culture and in intracranial xenografts in mouse brains. Results Knockdown of native NFIA blocked tumor growth and induced cell death and apoptosis. Complementing this, NFIA overexpression accelerated growth, proliferation, and migration of GBM in cell culture and in mouse brains. These NFIA tumor-promoting effects were mediated via transcriptional repression of p53, p21, and plasminogen activator inhibitor 1 (PAI1) through specific NFIA-recognition sequences in their promoters. Importantly, the effects of NFIA on proliferation and apoptosis were independent of TP53 mutation status, a finding especially relevant for GBM, in which TP53 is frequently mutated. Conclusion NFIA is a modulator of GBM growth and migration, and functions by distinct regulation of critical oncogenic pathways that govern the malignant behavior of GBM.

Keywords: PAI1; glioblastoma (GBM); glioma; nuclear factor IA (NFIA); p21; p53.


Figures

Fig. 1.
Fig. 1.
NFIA promotes growth of glioma cells in culture. (A) NFIA expression is elevated in malignant gliomas. Whisker plots of NFIA mRNA levels in malignant gliomas (AA, n=19; GBM, n=186) compared with normal brains were analyzed using 4 different datasets available from Oncomine (http://www.oncomine.org). The numbers above the plots indicate the number of samples. Also see Figure S1. (B) NFIA is expressed in glioma cells. Immunocytochemical staining for NFIA (green), GFAP (red), and Hoechst (blue). Scale bar: 50 µm. (C) Overexpression and knockdown of NFIA by shRNA (shNFIA) was verified by immunoblotting of whole cell lysates on day 3 after infection with NFIA, empty vector, shNFIA, or shRNA control (shCont). (D) Overexpression of NFIA increases, and shNFIA decreases the number of cultured glioma cells 3 days after infection with lentivirus NFIA (red), shNFIA (blue), and controls (vector only and shCont). *P<.05: P-values between parental cells and controls were not significant. (E) 3D colony formation in soft agar is increased in glioma cells overexpressing NFIA. U87 cells expressing NFIA, shNFIA, or controls 3 days after lentiviral transduction were plated in soft agar, and colonies were evaluated after 28 days. Shown are representative fields (left) and quantification of colonies larger than 0.1 mm (right) on day 28; n = 3, means ± SD; *P < .05, **P = .01.
Fig. 2.
Fig. 2.
NFIA controls proliferation and cell death. (A) NFIA promotes and shNFIA inhibits proliferation (BrdU uptake) of glioma cells freshly transduced with lentivirus expressing NFIA (red), shNFIA (blue), and controls. Means ± SD of 3 different experiments performed in 3 to 8 replicates; *P < .0001, **P < .05. (B) Knockdown of NFIA increases sub-G1 fraction of glioma cells. GBM1 or U87 glioma cells transduced with shNFIA or control analyzed by propidium iodide (PI) on day 3 after lentiviral infection; n = 3; *P < .0005, **P < .0001. (C) NFIA silencing increases caspase-3 activity. Caspase-3 activity was determined on day 3 after infection with shNFIA or shCont; n = 3; *P < .005, **P < .01. (D) Glioma cells infected with shNFIA or control shRNA were stained with SA-β-gal (x400) on day 3 of transduction. Quantification of SA-β-gal positive cells is on the right panel; n = 3, *P < .0001. Knockdown of NFIA is shown in panel E. (E) Loss of NFIA causes apoptosis evidenced by cleavage of PARP, caspase-8, and caspase-9. Whole cell lysates of glioma cells analyzed on day 3 after infection with shNFIA, vector control, or uninfected parental cells (immunoblotting). Shown is a representative experiment of 3 experiments. (F) Caspase inhibitor, Z-VAD, blocks shNFIA-induced PARP cleavage. Whole-cell lysates of shNFIA and control-infected U251 glioma cells 3 days after lentiviral infection and cultured with Z-VAD-fmk (20 μM) or vehicle (DMSO) for additional 24 and 48 hours were analyzed by immunoblotting. (G) *NFIA (protein coding domain only, resistant to the shNFIA) reverses shNFIA-induced PARP cleavage in U251 glioma cells. After 24 hour infection with shNFIA or control in U251, cells were reinfected with *NFIA for 48 hours and analyzed for PARP cleavage (left). Right panel: densitometric quantification; *P<.001, **P<.01. (H) NFIA protects glioma cells from etoposide-induced apoptosis. U251 glioma cells stably expressing NFIA or vector were treated with vehicle (DMSO) or etoposide (ETP, 1 μg/mL) in serum-free medium for 24 hours. Apoptosis was assessed using the Apo-Direct kit. Left panel: representative experiment of 3 experiments. The percentage of apoptotic cells (FITC-dUTP+ cells in top quadrants) is indicated for each condition. Right panel: means ± SD from 3 experiments; *P < .0001.
Fig. 3.
Fig. 3.
Apoptosis induced by loss of NFIA is mediated by p53. (A) Immunofluorescence of U87 cells expressing shNFIA and control (shCont) 4 days after transduction; p53 - red, Hoechst - blue. Arrowheads: examples of fragmented nuclei with high nuclear p53. Scale bar: 50 µm. (B) NFIA represses p53 mRNA. p53, p21, and NFIA mRNA (RT-PCR) from U87 cells transduced for 2 days with 0, 1/27, 1/9, 1/3, 1 µg lentiviral plasmid containing NFIA cDNA and adjusted to total 1 µg transfected DNA using empty-vector plasmid. Right panel: p53 mRNA normalized to GAPDH; n = 3; P < .0001 by 1-way ANOVA. (C) Loss of NFIA induces p53 in p53-wild-type U87 cells but not in the p53-mutant GBM1, U251 and LN18 cells. Glioma cells 3 days post lentiviral transduction with shNFIA or control shRNA were assessed for p53 and p21 expression by immunoblotting. (D) NFIA negatively regulates the p53 promoter. Top: NFIA consensus-binding sequence (−199 bp) in the p53 promoter. Left: relative luciferase activity 48 hours after transfection of p53 luciferase reporter into U87 cells stably expressing NFIA or vector or 3 days post lentiviral transduction with shNFIA or controls; *P < .005, **P < .05, see also Figure S4A. Right: relative luciferase assay using a wild-type p53 reporter or a mutated counterpart with destroyed NFIA binding site (see top panel) in U87 cells 3 days post lentiviral transduction with shNFIA or shCont; n = 3; *P < .01, **P < .001. (E) Knockdown of p53 attenuates shNFIA-induced caspase-3 activity in U87 cells but not in p53-mutant cells (GBM1 and U251). Glioma cells 3 days post lentiviral transduction with shNFIA or shCont were treated with p53 siRNA or control siRNA (100 nM) for 48 hours, and caspase-3 activity was measured; n = 3, *P < .05; Representative protein expression and densitometric analysis are shown in Figure S5.
Fig. 4.
Fig. 4.
Growth properties induced by NFIA is mediated by repression of p21. (A) NFIA represses p21 transcription. Normalized p21 mRNA relative to GAPDH in U87 cells transduced with increasing NFIA plasmid as described in Figure 3B (RT-PCR). P < .0001 by 1-way ANOVA; n = 3. (B) GAPDH-normalized p21 mRNA in U251 and GBM1 cells stably expressing NFIA or vector control; qPCR; *P < .0001. (C) Overexpression of NFIA regulates phosphorylation of cell-cycle dependent proteins, CDK2 (T160) and Rb (S780). Western blot of whole cell lysates of 18 hour serum-starved (ie, synchronized) glioma cells stably expressing NFIA or vector control. (D and E) Overexpression of p21 inhibits NFIA-induced cell growth and proliferation. Cell growth (D) or BrdU incorporation (E) were measured in U87 (p53-wild-type) or U251 (p53-mutant) cells stably expressing NFIA or vector that was transfected with p21 or empty-vector plasmid for 48 h. (assessed as in Figs 1D and 2A). Representative protein expression and densitometric analysis are shown in Figure S6A and B. *P < .01, **P < .0005 (D); *P = .001, **P < .0001 (E). (F) NFIA represses p21 promoter activity. Top: wild-type and mutant NFIA binding sites (161 bp) in the p21 promoter luciferase reporter. Left: luciferase activity was measured 48 hours after transfection of p21 luciferase reporter into U87 (p53-wild-type; top panels) or LN18 (p53-mutant; bottom panels) cells stably expressing NFIA or vector or 3 days post lentiviral transduction with shNFIA or controls; *P < .01, **P = .001; n = 3. Right: Relative luciferase activity of pGL3 wild-type (wt) or mutant (mt) p21 promoter transfected into U87 or LN18 cells expressing shNFIA or shCont similar to the left panel; see also Figure S6C for a schema; *P = .0001, **P < .05 (U87); *P < .005, **P < .001 (LN18).
Fig. 5.
Fig. 5.
NFIA enhances migration in glioma cells through PAI1. (A) Wound healing in U251 cells stably expressing NFIA or vector was assessed at 0, 12, 24, and 36 hours after wound was created. Migration into the wound was quantified as the percentage of wound closed at each time point; mean ± SD; *P < .0001. (B) Transwell migration assay of U87 and U251 cells stably expressing NFIA or vector; n = 3; *P < .005, **P = .001. (C) Transwell migration of U87-vector cells in conditioned media harvested from U87-vector or -NFIA stably expressing cells. Migration was measured as in B; *P < .005. See also Figure S7B. (D) NFIA represses PAI1 expression. Top: U87 and U251 cells stably expressing NFIA show lower PAI1 protein level. A representative immunoblotting of whole cell lysates; immunodensitometry from 3 independent experiments is shown in Figure S7C; *P < .0001. Bottom: relative PAI1 mRNA normalized to GAPDH in NFIA versus empty vector expressing cells in 3 experiments; quantification is shown in Figure S7C; *P < .001. (E) PAI1 secretion is suppressed in U87 cells overexpressing NFIA. Conditioned media from equal number of cells (2 × 10⁵) stably expressing NFIA or vector were harvested at the indicated times, analyzed by immunoblotting, and quantified by densitometry (see also Fig. S7E); *P < .05, **P = .0005. (F) Conditioned medium (24 h) from U87 cells stably expressing NFIA or vector from equal cell numbers was analyzed for expression of MMP2 by immunoblotting. Upper and lower arrows indicate pro and mature MMP2, respectively. Right: densitometry of MMP2 mature/total in 3 experiments; *P = .0001. (G) NFIA represses the PAI1 promoter. Top: NFIA DNA binding site (-540 bp) in the pGL3-PAI1 promoter reporter plasmid: wild-type or mutated to destroy the PAI1 binding site. Left: wild-type PAI1 reporter luciferase activity in U87 cells stably expressing NFIA or -vector, or 3 days post lentiviral transduction of shNFIA, or controls; *P < .05, **P < .0005. Right: relative luciferase activity of pGL3 wild-type (wt) or mutant (mt) PAI1 promoter reporter in U87 cells expressing shNFIA or shCont; *P < .005, **P = .01. (H and I) Addition of recombinant human PAI1 (rhPAI1) inhibits NFIA-induced migration in glioma cells. (H) Transwell migration of U87-NFIA or vector expressing cells with/without rhPAI1 (1 ng/mL). Left: representative field of 5. Right: mean ± SD migrated cells from 3 experiments; *P < .0001, **P < .005. (I) The effect of addition of rhPAI1 (1 ng/mL) in U251-NFIA or -vector stably expressing cells was measured by wound-healing assay. Percentage of wound closure; *P < .0005, **P < .0001. See also Figure S7F in Supplementary information.
Fig. 6.
Fig. 6.
NFIA is sufficient and necessary for glioma growth and invasion in mouse brain. U87 cells stably expressing NFIA or vector, or 3 days post lentiviral transduction of shNFIA, or control were orthotopically implanted into the brains of nude mice and followed. (A) MRI of intracranial tumors (arrows) in representative mice. Each brain is shown on day 21 and day 28 post tumor inoculation. (B) Mean ± SD of tumor volumes on day 28 MRI, measured using Metamorph. *P < .005 between NFIA versus control (n = 11 mice in each group); **P = .0001 between shNFIA vs shCont;n = 10 mice in each group. Performed in 2 separate identical experiments. (C) Kaplan–Meier survival curve of mice implanted with U87 cells overexpressing NFIA and vector control; n = 11 in each group; P < .001). (D) Ki67 immunohistochemistry of the orthotopic U87 tumors overexpressing NFIA or vector control. Mice were euthanized on day 28 post inoculation, and Ki67-positive cells were counted in 2 high-powered fields (x400) from 3 tumors for each condition. Bar graph shows means ± SD; *P = .0005. (E) Ectopic expression of NFIA in U87 enhances migration in vivo. Small groups of satellite tumor cells were found away from the main tumor mass in orthotopic U87 tumors overexpressing NFIA (examined at day 28). The inset of migrated cells is shown in magnification. Empty vector-expressing tumors revealed well-circumscribed tumor border (examined at days 35–38). Migrated cells were counted in 2 fields (x200) from 3 tumors for each condition; *P < .005. (F) NFIA promotes GBM growth by regulation of p53, p21, and PAI1. NFIA suppresses p53, p21, and PAI1 expression, resulting in decreased apoptosis and increased proliferation and migration, which leads to the enhanced tumor growth.

Similar articles

Cited by

References

    1. Stupp R, Hegi ME, Mason WP, et al. Effects of radiotherapy with concomitant and adjuvant temozolomide versus radiotherapy alone on survival in glioblastoma in a randomised phase III study: 5-year analysis of the EORTC-NCIC trial. Lancet Oncol. 2009;10(5):459–466. - PubMed
    1. Hanahan D, Weinberg RA. Hallmarks of cancer: the next generation. Cell. 2011;144(5):646–674. - PubMed
    1. Siebzehnrubl FA, Reynolds BA, Vescovi A, Steindler DA, Deleyrolle LP. The origins of glioma: E Pluribus Unum? Glia. 2011;59(8):1135–1147. - PubMed
    1. Ligon KL, Huillard E, Mehta S, et al. Olig2-regulated lineage-restricted pathway controls replication competence in neural stem cells and malignant glioma. Neuron. 2007;53(4):503–517. - PMC - PubMed
    1. Sun Y, Meijer DH, Alberta JA, et al. Phosphorylation state of Olig2 regulates proliferation of neural progenitors. Neuron. 2011;69(5):906–917. - PMC - PubMed

Publication types

MeSH terms