

MDR1 synonymous polymorphisms alter transporter specificity and protein stability in a stable epithelial monolayer
- PMID: 24305879
- PMCID: PMC4784985
- DOI: 10.1158/0008-5472.CAN-13-2064
MDR1 synonymous polymorphisms alter transporter specificity and protein stability in a stable epithelial monolayer
Abstract
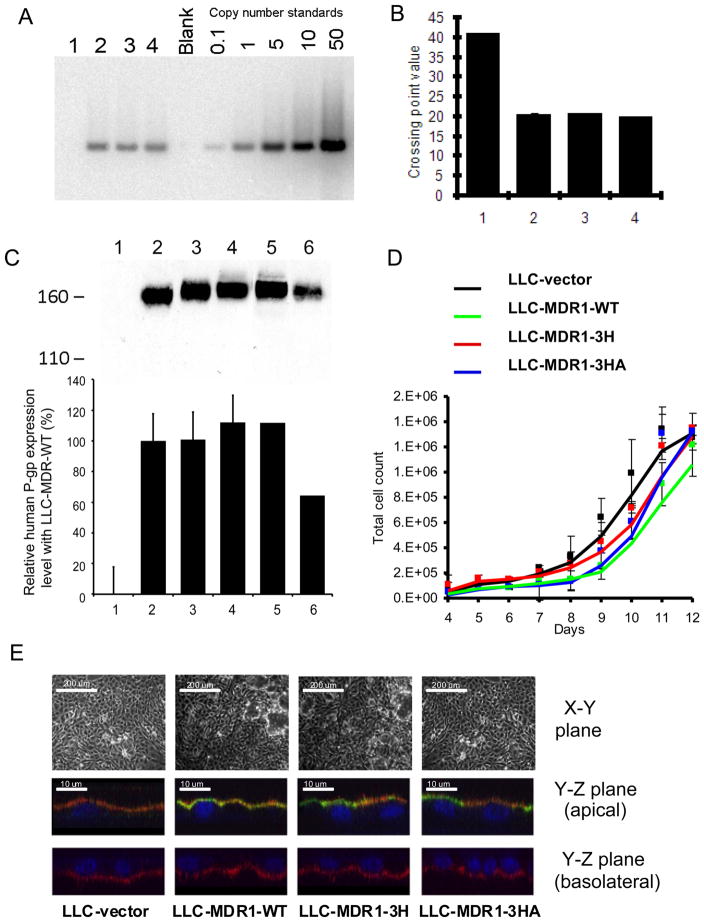
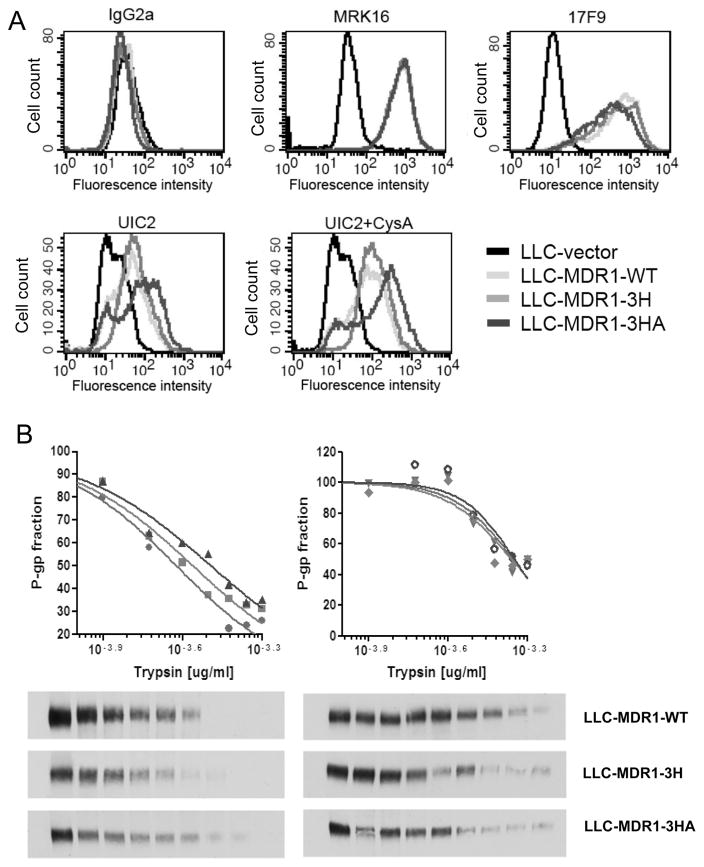
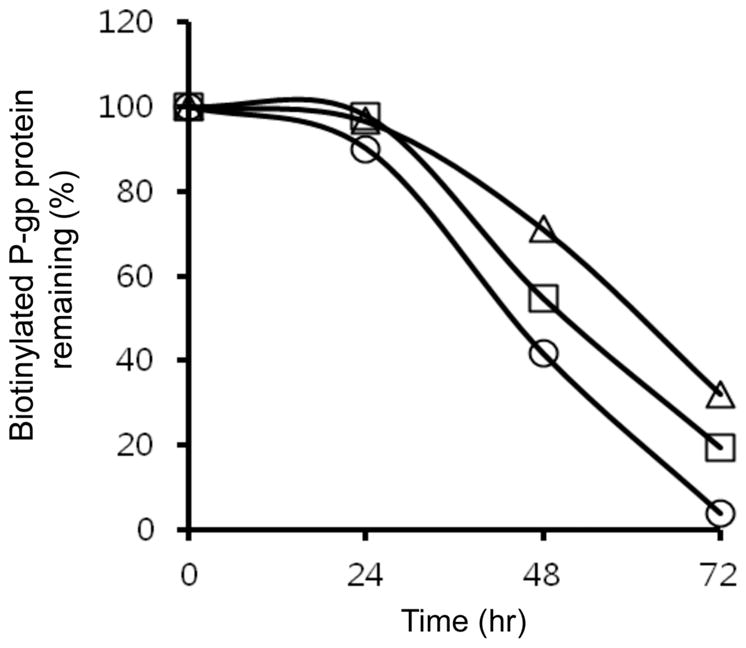
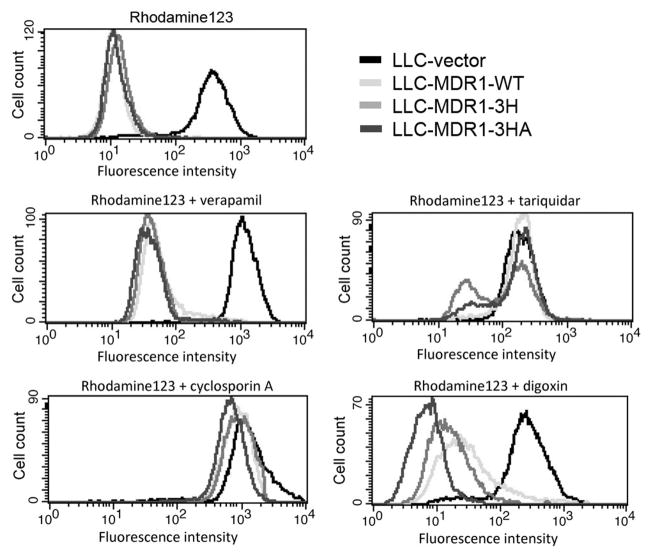
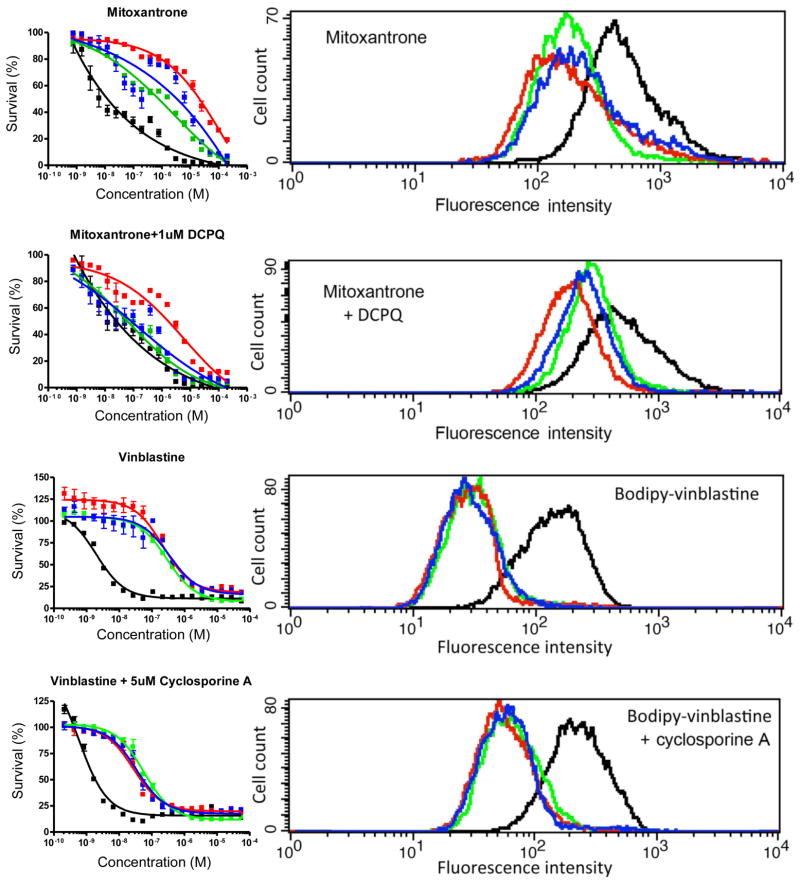
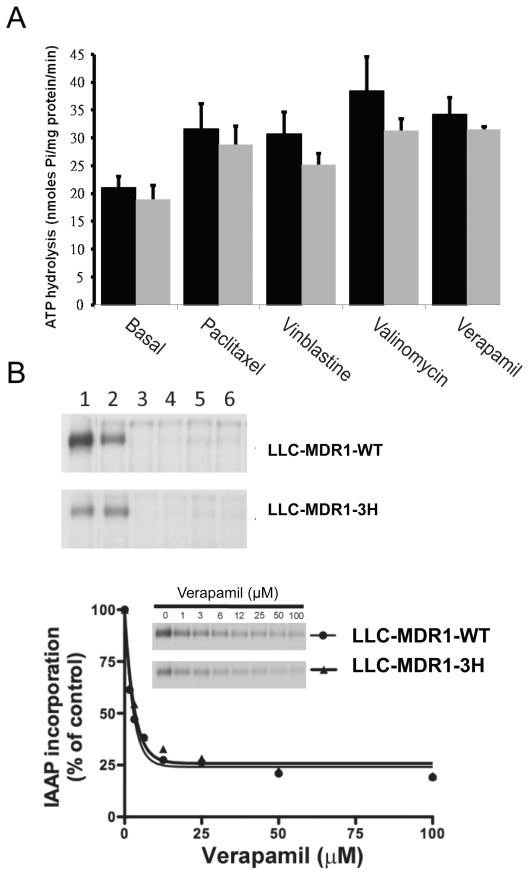
The drug efflux function of P-glycoprotein (P-gp) encoded by MDR1 can be influenced by genetic polymorphisms, including two synonymous changes in the coding region of MDR1. Here we report that the conformation of P-gp and its drug efflux activity can be altered by synonymous polymorphisms in stable epithelial monolayers expressing P-gp. Several cell lines with similar MDR1 DNA copy number were developed and termed LLC-MDR1-WT (expresses wild-type P-gp), LLC-MDR1-3H (expresses common haplotype P-gp), and LLC-MDR1-3HA (a mutant that carries a different valine codon in position 3435). These cell lines express similar levels of recombinant mRNA and protein. P-gp in each case is localized on the apical surface of polarized cells. However, the haplotype and its mutant P-gps fold differently from the wild-type, as determined by UIC2 antibody shift assays and limited proteolysis assays. Surface biotinylation experiments suggest that the non-wild-type P-gps have longer recycling times. Drug transport assays show that wild-type and haplotype P-gp respond differently to P-gp inhibitors that block efflux of rhodamine 123 or mitoxantrone. In addition, cytotoxicity assays show that the LLC-MDR1-3H cells are more resistant to mitoxantrone than the LLC-MDR1-WT cells after being treated with a P-gp inhibitor. Expression of polymorphic P-gp, however, does not affect the host cell's morphology, growth rate, or monolayer formation. Also, ATPase activity assays indicate that neither basal nor drug-stimulated ATPase activities are affected in the variant P-gps. Taken together, our findings indicate that "silent" polymorphisms significantly change P-gp function, which would be expected to affect interindividual drug disposition and response.
Conflict of interest statement
No potential conflicts of interest were disclosed.
Figures
Similar articles
-
Effects of MDR1 1236C > T-2677G > T-3435C > T polymorphisms on the intracellular accumulation of tacrolimus, cyclosporine A, sirolimus and everolimus.Xenobiotica. 2019 Nov;49(11):1373-1378. doi: 10.1080/00498254.2018.1563732. Epub 2019 Jun 14. Xenobiotica. 2019. PMID: 30587068
-
Specificity of doxorubicin versus rhodamine-123 in assessing P-glycoprotein functionality in the LLC-PK1, LLC-PK1:MDR1 and Caco-2 cell lines.Eur J Pharm Sci. 2000 Sep;11(3):207-14. doi: 10.1016/s0928-0987(00)00097-x. Eur J Pharm Sci. 2000. PMID: 11042226
-
Structure, function and regulation of P-glycoprotein and its clinical relevance in drug disposition.Xenobiotica. 2008 Jul;38(7-8):802-32. doi: 10.1080/00498250701867889. Xenobiotica. 2008. PMID: 18668431 Review.
-
Differences in the expression of endogenous efflux transporters in MDR1-transfected versus wildtype cell lines affect P-glycoprotein mediated drug transport.Br J Pharmacol. 2010 Jul;160(6):1453-63. doi: 10.1111/j.1476-5381.2010.00801.x. Br J Pharmacol. 2010. PMID: 20590635 Free PMC article.
-
The role of MDR1 genetic polymorphisms in interindividual variability in P-glycoprotein expression and function.Curr Drug Metab. 2004 Feb;5(1):11-9. doi: 10.2174/1389200043489108. Curr Drug Metab. 2004. PMID: 14965248 Review.
Cited by
-
ATP-binding cassette subfamily B member 1 (ABCB1) and subfamily C member 10 (ABCC10) are not primary resistance factors for cabazitaxel.Chin J Cancer. 2015 Mar 5;34(3):115-20. doi: 10.1186/s40880-015-0003-0. Chin J Cancer. 2015. PMID: 25962593 Free PMC article.
-
A comparative analysis of SARS-CoV-2 antivirals in human airway models characterizes 3CLpro inhibitor PF-00835231 as a potential new treatment for COVID-19.bioRxiv [Preprint]. 2021 Feb 19:2020.08.28.272880. doi: 10.1101/2020.08.28.272880. bioRxiv. 2021. Update in: J Virol. 2021 Feb 23;95(7):JVI.01819-20. doi: 10.1128/JVI.01819-20. PMID: 32869028 Free PMC article. Updated. Preprint.
-
Combined Influence of Genetic Polymorphism and DNA Methylation on ABCB1 Expression and Function in Healthy Chinese Males.Eur J Drug Metab Pharmacokinet. 2017 Aug;42(4):627-634. doi: 10.1007/s13318-016-0376-8. Eur J Drug Metab Pharmacokinet. 2017. PMID: 27683186
-
The Role of Brain Microvascular Endothelial Cell and Blood-Brain Barrier Dysfunction in Schizophrenia.Complex Psychiatry. 2020 Oct;6(1-2):30-46. doi: 10.1159/000511552. Epub 2020 Sep 14. Complex Psychiatry. 2020. PMID: 34883503 Free PMC article. Review.
-
First report of a novel polymorphism and genetic characteristics of the leporine prion protein (PRNP) gene.Front Vet Sci. 2023 Sep 22;10:1229369. doi: 10.3389/fvets.2023.1229369. eCollection 2023. Front Vet Sci. 2023. PMID: 37808111 Free PMC article.
References
-
- Schinkel AH. The physiological function of drug-transporting P-glycoproteins. Semin Cancer Biol. 1997;8:161–70. - PubMed
-
- Schinkel AH, Smit JJ, van Tellingen O, Beijnen JH, Wagenaar E, van Deemter L, et al. Disruption of the mouse mdr1a P-glycoprotein gene leads to a deficiency in the blood-brain barrier and to increased sensitivity to drugs. Cell. 1994;77:491–502. - PubMed
Publication types
MeSH terms
Substances
Grants and funding
LinkOut - more resources
Full Text Sources
Other Literature Sources
Miscellaneous
